Guyanese vs Belgian Female Poverty
COMPARE
Guyanese
Belgian
Female Poverty
Female Poverty Comparison
Guyanese
Belgians
15.6%
FEMALE POVERTY
0.1/ 100
METRIC RATING
261st/ 347
METRIC RANK
12.4%
FEMALE POVERTY
95.8/ 100
METRIC RATING
91st/ 347
METRIC RANK
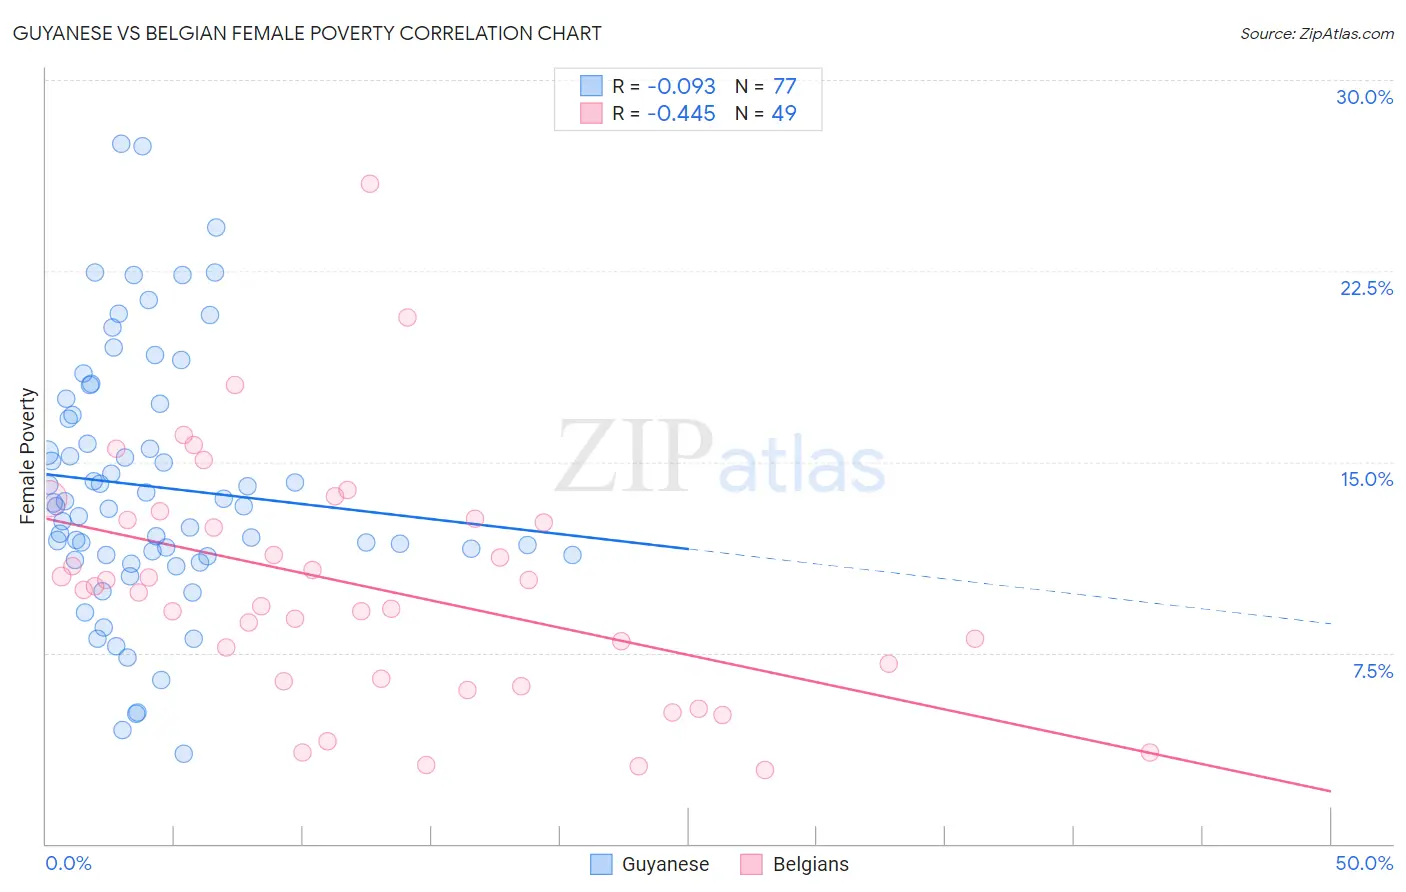
Guyanese vs Belgian Female Poverty Correlation Chart
The statistical analysis conducted on geographies consisting of 176,777,611 people shows a slight negative correlation between the proportion of Guyanese and poverty level among females in the United States with a correlation coefficient (R) of -0.093 and weighted average of 15.6%. Similarly, the statistical analysis conducted on geographies consisting of 355,775,724 people shows a moderate negative correlation between the proportion of Belgians and poverty level among females in the United States with a correlation coefficient (R) of -0.445 and weighted average of 12.4%, a difference of 25.5%.
Female Poverty Correlation Summary
| Measurement | Guyanese | Belgian |
| Minimum | 3.5% | 2.9% |
| Maximum | 27.5% | 25.9% |
| Range | 24.0% | 23.0% |
| Mean | 14.0% | 10.1% |
| Median | 13.3% | 10.0% |
| Interquartile 25% (IQ1) | 11.3% | 6.4% |
| Interquartile 75% (IQ3) | 17.1% | 12.8% |
| Interquartile Range (IQR) | 5.7% | 6.3% |
| Standard Deviation (Sample) | 5.0% | 4.7% |
| Standard Deviation (Population) | 5.0% | 4.6% |
Similar Demographics by Female Poverty
Demographics Similar to Guyanese by Female Poverty
In terms of female poverty, the demographic groups most similar to Guyanese are Mexican American Indian (15.6%, a difference of 0.0%), Cherokee (15.6%, a difference of 0.010%), Immigrants from Guyana (15.6%, a difference of 0.10%), Immigrants from Ecuador (15.6%, a difference of 0.14%), and Cape Verdean (15.6%, a difference of 0.18%).
| Demographics | Rating | Rank | Female Poverty |
| Trinidadians and Tobagonians | 0.2 /100 | #254 | Tragic 15.4% |
| Ottawa | 0.2 /100 | #255 | Tragic 15.5% |
| Jamaicans | 0.2 /100 | #256 | Tragic 15.5% |
| Immigrants | Jamaica | 0.1 /100 | #257 | Tragic 15.6% |
| Shoshone | 0.1 /100 | #258 | Tragic 15.6% |
| Cape Verdeans | 0.1 /100 | #259 | Tragic 15.6% |
| Immigrants | Guyana | 0.1 /100 | #260 | Tragic 15.6% |
| Guyanese | 0.1 /100 | #261 | Tragic 15.6% |
| Mexican American Indians | 0.1 /100 | #262 | Tragic 15.6% |
| Cherokee | 0.1 /100 | #263 | Tragic 15.6% |
| Immigrants | Ecuador | 0.1 /100 | #264 | Tragic 15.6% |
| Immigrants | Liberia | 0.1 /100 | #265 | Tragic 15.7% |
| Immigrants | El Salvador | 0.1 /100 | #266 | Tragic 15.7% |
| Sub-Saharan Africans | 0.1 /100 | #267 | Tragic 15.8% |
| Immigrants | Nicaragua | 0.1 /100 | #268 | Tragic 15.8% |
Demographics Similar to Belgians by Female Poverty
In terms of female poverty, the demographic groups most similar to Belgians are Immigrants from Denmark (12.4%, a difference of 0.010%), Czechoslovakian (12.4%, a difference of 0.010%), Immigrants from Egypt (12.5%, a difference of 0.18%), Immigrants from Indonesia (12.5%, a difference of 0.21%), and English (12.4%, a difference of 0.23%).
| Demographics | Rating | Rank | Female Poverty |
| Northern Europeans | 96.6 /100 | #84 | Exceptional 12.4% |
| Irish | 96.5 /100 | #85 | Exceptional 12.4% |
| Dutch | 96.5 /100 | #86 | Exceptional 12.4% |
| Okinawans | 96.4 /100 | #87 | Exceptional 12.4% |
| Finns | 96.4 /100 | #88 | Exceptional 12.4% |
| English | 96.1 /100 | #89 | Exceptional 12.4% |
| Immigrants | Denmark | 95.8 /100 | #90 | Exceptional 12.4% |
| Belgians | 95.8 /100 | #91 | Exceptional 12.4% |
| Czechoslovakians | 95.7 /100 | #92 | Exceptional 12.4% |
| Immigrants | Egypt | 95.5 /100 | #93 | Exceptional 12.5% |
| Immigrants | Indonesia | 95.4 /100 | #94 | Exceptional 12.5% |
| Immigrants | South Africa | 95.4 /100 | #95 | Exceptional 12.5% |
| British | 95.2 /100 | #96 | Exceptional 12.5% |
| Australians | 95.2 /100 | #97 | Exceptional 12.5% |
| Native Hawaiians | 95.1 /100 | #98 | Exceptional 12.5% |