Colombian vs Belgian Female Poverty
COMPARE
Colombian
Belgian
Female Poverty
Female Poverty Comparison
Colombians
Belgians
13.4%
FEMALE POVERTY
55.7/ 100
METRIC RATING
170th/ 347
METRIC RANK
12.4%
FEMALE POVERTY
95.8/ 100
METRIC RATING
91st/ 347
METRIC RANK
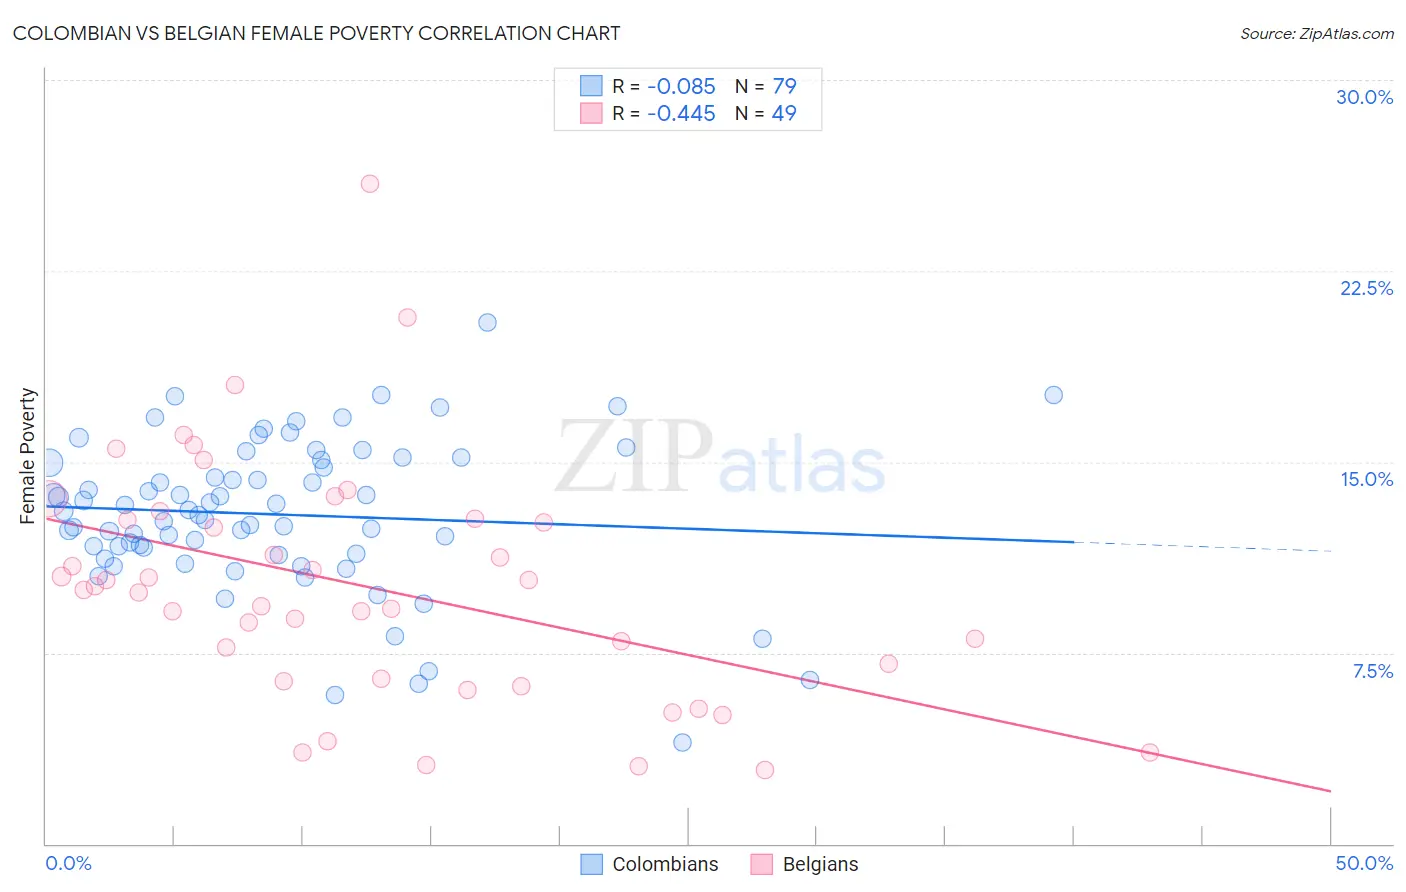
Colombian vs Belgian Female Poverty Correlation Chart
The statistical analysis conducted on geographies consisting of 419,235,280 people shows a slight negative correlation between the proportion of Colombians and poverty level among females in the United States with a correlation coefficient (R) of -0.085 and weighted average of 13.4%. Similarly, the statistical analysis conducted on geographies consisting of 355,775,724 people shows a moderate negative correlation between the proportion of Belgians and poverty level among females in the United States with a correlation coefficient (R) of -0.445 and weighted average of 12.4%, a difference of 7.5%.
Female Poverty Correlation Summary
| Measurement | Colombian | Belgian |
| Minimum | 4.0% | 2.9% |
| Maximum | 20.5% | 25.9% |
| Range | 16.5% | 23.0% |
| Mean | 12.9% | 10.1% |
| Median | 13.1% | 10.0% |
| Interquartile 25% (IQ1) | 11.4% | 6.4% |
| Interquartile 75% (IQ3) | 15.1% | 12.8% |
| Interquartile Range (IQR) | 3.7% | 6.3% |
| Standard Deviation (Sample) | 3.0% | 4.7% |
| Standard Deviation (Population) | 3.0% | 4.6% |
Similar Demographics by Female Poverty
Demographics Similar to Colombians by Female Poverty
In terms of female poverty, the demographic groups most similar to Colombians are Lebanese (13.4%, a difference of 0.020%), Aleut (13.4%, a difference of 0.10%), White/Caucasian (13.4%, a difference of 0.11%), Immigrants from Chile (13.3%, a difference of 0.16%), and Mongolian (13.4%, a difference of 0.21%).
| Demographics | Rating | Rank | Female Poverty |
| Immigrants | Albania | 62.4 /100 | #163 | Good 13.3% |
| Ethiopians | 62.3 /100 | #164 | Good 13.3% |
| Scotch-Irish | 62.1 /100 | #165 | Good 13.3% |
| Immigrants | Oceania | 59.7 /100 | #166 | Average 13.3% |
| Immigrants | Chile | 57.4 /100 | #167 | Average 13.3% |
| Aleuts | 56.7 /100 | #168 | Average 13.4% |
| Lebanese | 55.9 /100 | #169 | Average 13.4% |
| Colombians | 55.7 /100 | #170 | Average 13.4% |
| Whites/Caucasians | 54.6 /100 | #171 | Average 13.4% |
| Mongolians | 53.6 /100 | #172 | Average 13.4% |
| Immigrants | Afghanistan | 50.8 /100 | #173 | Average 13.4% |
| Immigrants | Iraq | 50.0 /100 | #174 | Average 13.4% |
| Celtics | 49.9 /100 | #175 | Average 13.4% |
| Immigrants | Spain | 49.9 /100 | #176 | Average 13.4% |
| Immigrants | Morocco | 49.4 /100 | #177 | Average 13.4% |
Demographics Similar to Belgians by Female Poverty
In terms of female poverty, the demographic groups most similar to Belgians are Immigrants from Denmark (12.4%, a difference of 0.010%), Czechoslovakian (12.4%, a difference of 0.010%), Immigrants from Egypt (12.5%, a difference of 0.18%), Immigrants from Indonesia (12.5%, a difference of 0.21%), and English (12.4%, a difference of 0.23%).
| Demographics | Rating | Rank | Female Poverty |
| Northern Europeans | 96.6 /100 | #84 | Exceptional 12.4% |
| Irish | 96.5 /100 | #85 | Exceptional 12.4% |
| Dutch | 96.5 /100 | #86 | Exceptional 12.4% |
| Okinawans | 96.4 /100 | #87 | Exceptional 12.4% |
| Finns | 96.4 /100 | #88 | Exceptional 12.4% |
| English | 96.1 /100 | #89 | Exceptional 12.4% |
| Immigrants | Denmark | 95.8 /100 | #90 | Exceptional 12.4% |
| Belgians | 95.8 /100 | #91 | Exceptional 12.4% |
| Czechoslovakians | 95.7 /100 | #92 | Exceptional 12.4% |
| Immigrants | Egypt | 95.5 /100 | #93 | Exceptional 12.5% |
| Immigrants | Indonesia | 95.4 /100 | #94 | Exceptional 12.5% |
| Immigrants | South Africa | 95.4 /100 | #95 | Exceptional 12.5% |
| British | 95.2 /100 | #96 | Exceptional 12.5% |
| Australians | 95.2 /100 | #97 | Exceptional 12.5% |
| Native Hawaiians | 95.1 /100 | #98 | Exceptional 12.5% |