Cambodian vs Armenian Single Female Poverty
COMPARE
Cambodian
Armenian
Single Female Poverty
Single Female Poverty Comparison
Cambodians
Armenians
19.2%
SINGLE FEMALE POVERTY
99.6/ 100
METRIC RATING
61st/ 347
METRIC RANK
18.3%
SINGLE FEMALE POVERTY
100.0/ 100
METRIC RATING
24th/ 347
METRIC RANK
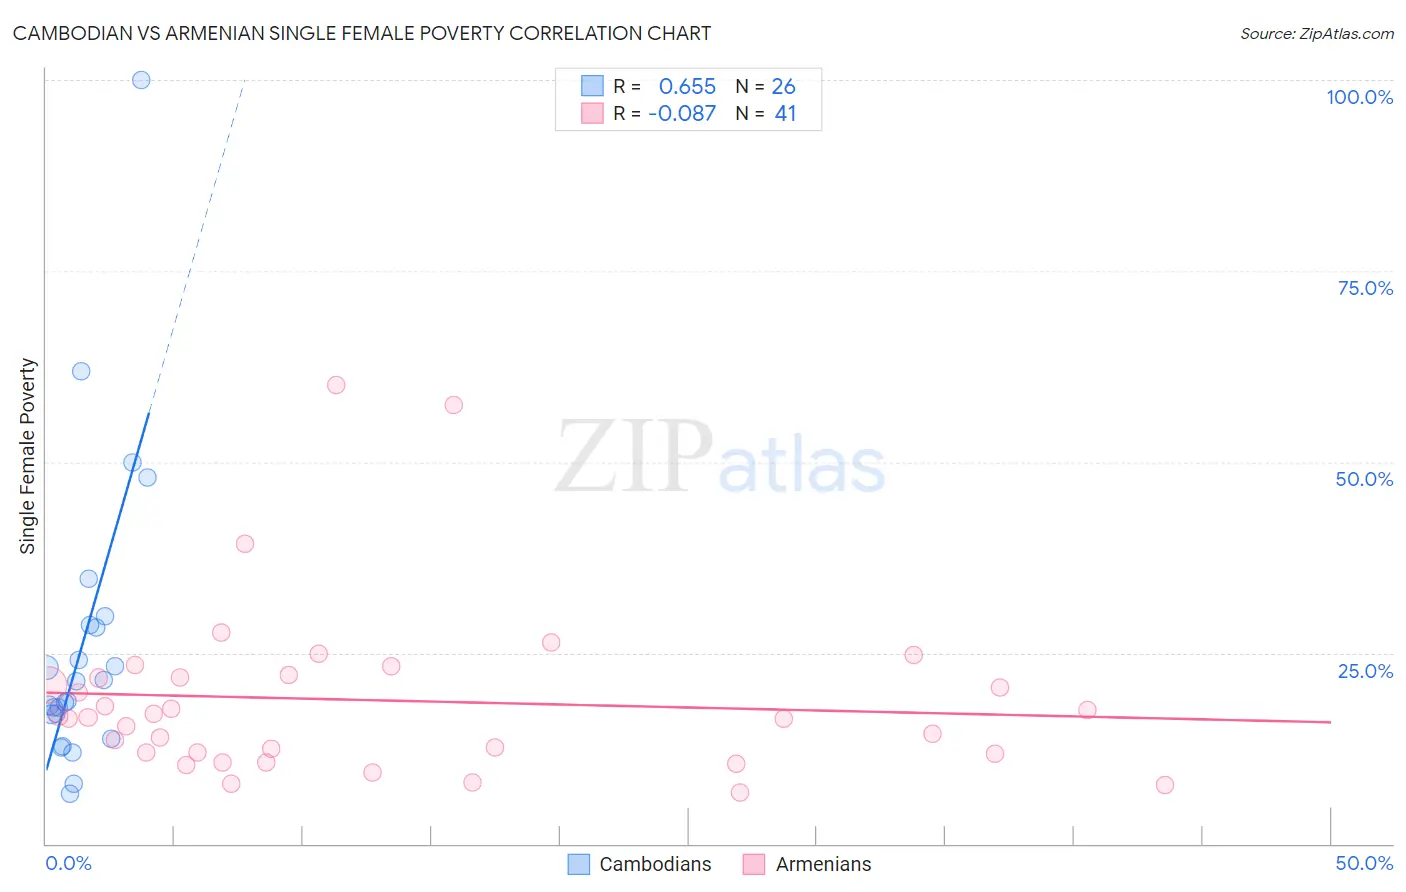
Cambodian vs Armenian Single Female Poverty Correlation Chart
The statistical analysis conducted on geographies consisting of 102,115,790 people shows a significant positive correlation between the proportion of Cambodians and poverty level among single females in the United States with a correlation coefficient (R) of 0.655 and weighted average of 19.2%. Similarly, the statistical analysis conducted on geographies consisting of 305,765,462 people shows a slight negative correlation between the proportion of Armenians and poverty level among single females in the United States with a correlation coefficient (R) of -0.087 and weighted average of 18.3%, a difference of 4.8%.
Single Female Poverty Correlation Summary
| Measurement | Cambodian | Armenian |
| Minimum | 6.6% | 6.7% |
| Maximum | 100.0% | 60.0% |
| Range | 93.4% | 53.3% |
| Mean | 26.3% | 18.8% |
| Median | 19.9% | 16.5% |
| Interquartile 25% (IQ1) | 17.0% | 11.9% |
| Interquartile 75% (IQ3) | 28.6% | 21.9% |
| Interquartile Range (IQR) | 11.6% | 10.1% |
| Standard Deviation (Sample) | 19.9% | 11.3% |
| Standard Deviation (Population) | 19.5% | 11.1% |
Similar Demographics by Single Female Poverty
Demographics Similar to Cambodians by Single Female Poverty
In terms of single female poverty, the demographic groups most similar to Cambodians are Russian (19.2%, a difference of 0.020%), Lithuanian (19.2%, a difference of 0.050%), Sri Lankan (19.2%, a difference of 0.12%), Immigrants from Northern Europe (19.2%, a difference of 0.17%), and Immigrants from Europe (19.2%, a difference of 0.18%).
| Demographics | Rating | Rank | Single Female Poverty |
| Argentineans | 99.7 /100 | #54 | Exceptional 19.1% |
| Immigrants | Vietnam | 99.7 /100 | #55 | Exceptional 19.1% |
| Immigrants | Fiji | 99.7 /100 | #56 | Exceptional 19.1% |
| Eastern Europeans | 99.7 /100 | #57 | Exceptional 19.1% |
| Immigrants | Bulgaria | 99.7 /100 | #58 | Exceptional 19.1% |
| Sri Lankans | 99.6 /100 | #59 | Exceptional 19.2% |
| Russians | 99.6 /100 | #60 | Exceptional 19.2% |
| Cambodians | 99.6 /100 | #61 | Exceptional 19.2% |
| Lithuanians | 99.6 /100 | #62 | Exceptional 19.2% |
| Immigrants | Northern Europe | 99.6 /100 | #63 | Exceptional 19.2% |
| Immigrants | Europe | 99.6 /100 | #64 | Exceptional 19.2% |
| Cypriots | 99.6 /100 | #65 | Exceptional 19.2% |
| Palestinians | 99.6 /100 | #66 | Exceptional 19.2% |
| Immigrants | Egypt | 99.6 /100 | #67 | Exceptional 19.2% |
| Laotians | 99.5 /100 | #68 | Exceptional 19.3% |
Demographics Similar to Armenians by Single Female Poverty
In terms of single female poverty, the demographic groups most similar to Armenians are Immigrants from Singapore (18.3%, a difference of 0.10%), Immigrants from Israel (18.3%, a difference of 0.12%), Burmese (18.3%, a difference of 0.23%), Asian (18.3%, a difference of 0.23%), and Maltese (18.3%, a difference of 0.24%).
| Demographics | Rating | Rank | Single Female Poverty |
| Immigrants | Korea | 100.0 /100 | #17 | Exceptional 18.1% |
| Immigrants | Eastern Asia | 100.0 /100 | #18 | Exceptional 18.1% |
| Immigrants | China | 100.0 /100 | #19 | Exceptional 18.1% |
| Immigrants | Greece | 100.0 /100 | #20 | Exceptional 18.3% |
| Maltese | 100.0 /100 | #21 | Exceptional 18.3% |
| Burmese | 100.0 /100 | #22 | Exceptional 18.3% |
| Asians | 100.0 /100 | #23 | Exceptional 18.3% |
| Armenians | 100.0 /100 | #24 | Exceptional 18.3% |
| Immigrants | Singapore | 100.0 /100 | #25 | Exceptional 18.3% |
| Immigrants | Israel | 100.0 /100 | #26 | Exceptional 18.3% |
| Immigrants | Pakistan | 100.0 /100 | #27 | Exceptional 18.4% |
| Immigrants | Moldova | 100.0 /100 | #28 | Exceptional 18.5% |
| Immigrants | Poland | 100.0 /100 | #29 | Exceptional 18.5% |
| Immigrants | North Macedonia | 99.9 /100 | #30 | Exceptional 18.5% |
| Immigrants | Asia | 99.9 /100 | #31 | Exceptional 18.6% |