Cambodian vs Ukrainian Single Female Poverty
COMPARE
Cambodian
Ukrainian
Single Female Poverty
Single Female Poverty Comparison
Cambodians
Ukrainians
19.2%
SINGLE FEMALE POVERTY
99.6/ 100
METRIC RATING
61st/ 347
METRIC RANK
19.8%
SINGLE FEMALE POVERTY
97.6/ 100
METRIC RATING
100th/ 347
METRIC RANK
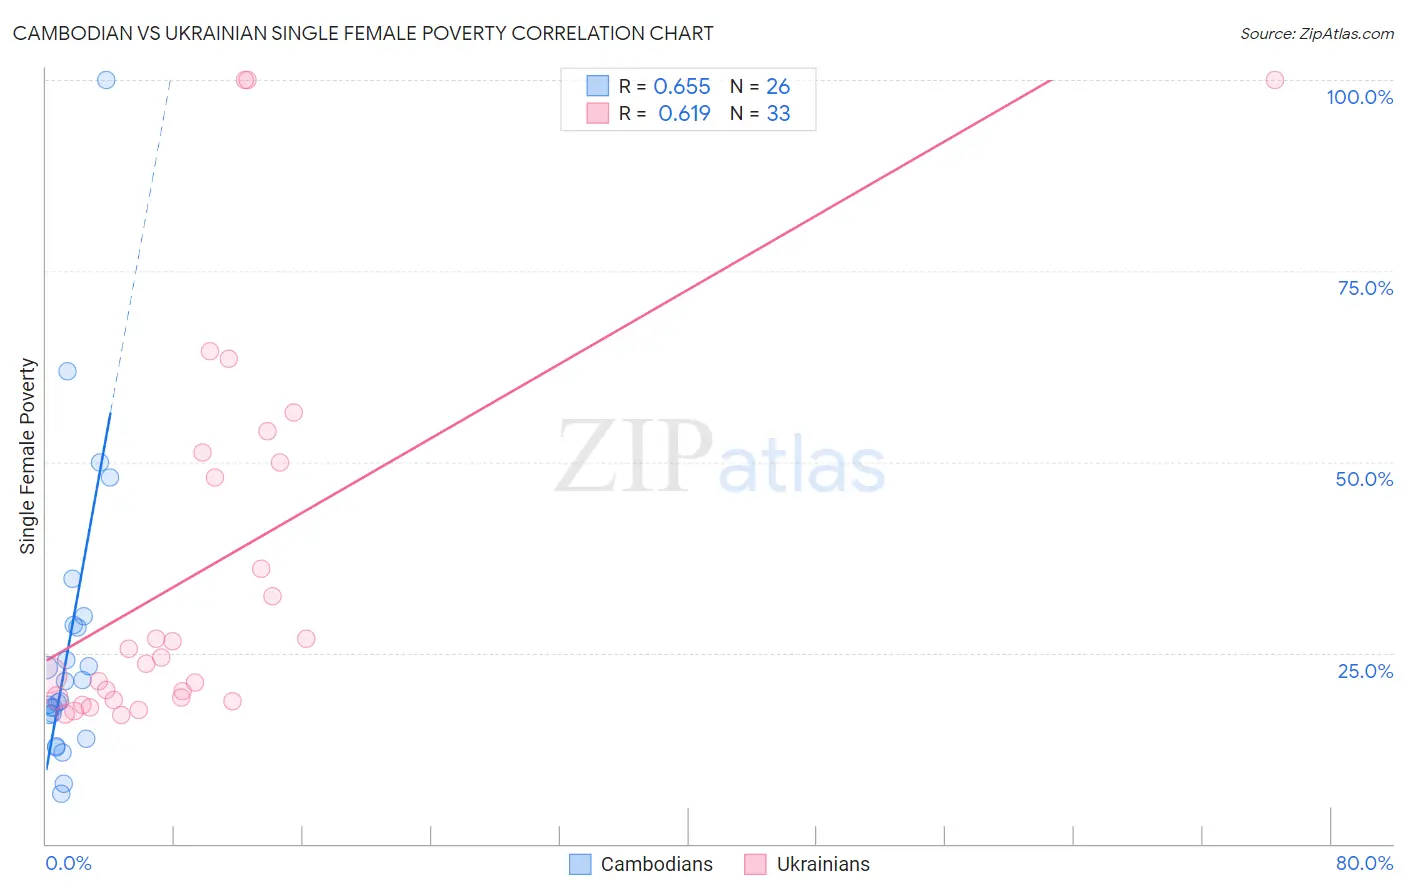
Cambodian vs Ukrainian Single Female Poverty Correlation Chart
The statistical analysis conducted on geographies consisting of 102,115,790 people shows a significant positive correlation between the proportion of Cambodians and poverty level among single females in the United States with a correlation coefficient (R) of 0.655 and weighted average of 19.2%. Similarly, the statistical analysis conducted on geographies consisting of 437,822,135 people shows a significant positive correlation between the proportion of Ukrainians and poverty level among single females in the United States with a correlation coefficient (R) of 0.619 and weighted average of 19.8%, a difference of 3.2%.
Single Female Poverty Correlation Summary
| Measurement | Cambodian | Ukrainian |
| Minimum | 6.6% | 16.8% |
| Maximum | 100.0% | 100.0% |
| Range | 93.4% | 83.2% |
| Mean | 26.3% | 36.2% |
| Median | 19.9% | 24.4% |
| Interquartile 25% (IQ1) | 17.0% | 19.0% |
| Interquartile 75% (IQ3) | 28.6% | 50.6% |
| Interquartile Range (IQR) | 11.6% | 31.6% |
| Standard Deviation (Sample) | 19.9% | 25.1% |
| Standard Deviation (Population) | 19.5% | 24.8% |
Similar Demographics by Single Female Poverty
Demographics Similar to Cambodians by Single Female Poverty
In terms of single female poverty, the demographic groups most similar to Cambodians are Russian (19.2%, a difference of 0.020%), Lithuanian (19.2%, a difference of 0.050%), Sri Lankan (19.2%, a difference of 0.12%), Immigrants from Northern Europe (19.2%, a difference of 0.17%), and Immigrants from Europe (19.2%, a difference of 0.18%).
| Demographics | Rating | Rank | Single Female Poverty |
| Argentineans | 99.7 /100 | #54 | Exceptional 19.1% |
| Immigrants | Vietnam | 99.7 /100 | #55 | Exceptional 19.1% |
| Immigrants | Fiji | 99.7 /100 | #56 | Exceptional 19.1% |
| Eastern Europeans | 99.7 /100 | #57 | Exceptional 19.1% |
| Immigrants | Bulgaria | 99.7 /100 | #58 | Exceptional 19.1% |
| Sri Lankans | 99.6 /100 | #59 | Exceptional 19.2% |
| Russians | 99.6 /100 | #60 | Exceptional 19.2% |
| Cambodians | 99.6 /100 | #61 | Exceptional 19.2% |
| Lithuanians | 99.6 /100 | #62 | Exceptional 19.2% |
| Immigrants | Northern Europe | 99.6 /100 | #63 | Exceptional 19.2% |
| Immigrants | Europe | 99.6 /100 | #64 | Exceptional 19.2% |
| Cypriots | 99.6 /100 | #65 | Exceptional 19.2% |
| Palestinians | 99.6 /100 | #66 | Exceptional 19.2% |
| Immigrants | Egypt | 99.6 /100 | #67 | Exceptional 19.2% |
| Laotians | 99.5 /100 | #68 | Exceptional 19.3% |
Demographics Similar to Ukrainians by Single Female Poverty
In terms of single female poverty, the demographic groups most similar to Ukrainians are Immigrants from Belgium (19.8%, a difference of 0.18%), Immigrants from Cameroon (19.8%, a difference of 0.19%), Sierra Leonean (19.7%, a difference of 0.25%), Immigrants from France (19.7%, a difference of 0.26%), and Immigrants from Southern Europe (19.9%, a difference of 0.31%).
| Demographics | Rating | Rank | Single Female Poverty |
| Immigrants | Austria | 98.8 /100 | #93 | Exceptional 19.6% |
| Romanians | 98.6 /100 | #94 | Exceptional 19.6% |
| Estonians | 98.2 /100 | #95 | Exceptional 19.7% |
| Immigrants | Brazil | 98.2 /100 | #96 | Exceptional 19.7% |
| Croatians | 98.1 /100 | #97 | Exceptional 19.7% |
| Immigrants | France | 97.9 /100 | #98 | Exceptional 19.7% |
| Sierra Leoneans | 97.9 /100 | #99 | Exceptional 19.7% |
| Ukrainians | 97.6 /100 | #100 | Exceptional 19.8% |
| Immigrants | Belgium | 97.3 /100 | #101 | Exceptional 19.8% |
| Immigrants | Cameroon | 97.3 /100 | #102 | Exceptional 19.8% |
| Immigrants | Southern Europe | 97.1 /100 | #103 | Exceptional 19.9% |
| Chileans | 96.9 /100 | #104 | Exceptional 19.9% |
| Israelis | 96.9 /100 | #105 | Exceptional 19.9% |
| Ethiopians | 96.7 /100 | #106 | Exceptional 19.9% |
| Immigrants | Syria | 96.7 /100 | #107 | Exceptional 19.9% |