British vs Immigrants from Middle Africa Male Poverty
COMPARE
British
Immigrants from Middle Africa
Male Poverty
Male Poverty Comparison
British
Immigrants from Middle Africa
10.4%
MALE POVERTY
94.8/ 100
METRIC RATING
91st/ 347
METRIC RANK
12.7%
MALE POVERTY
0.4/ 100
METRIC RATING
240th/ 347
METRIC RANK
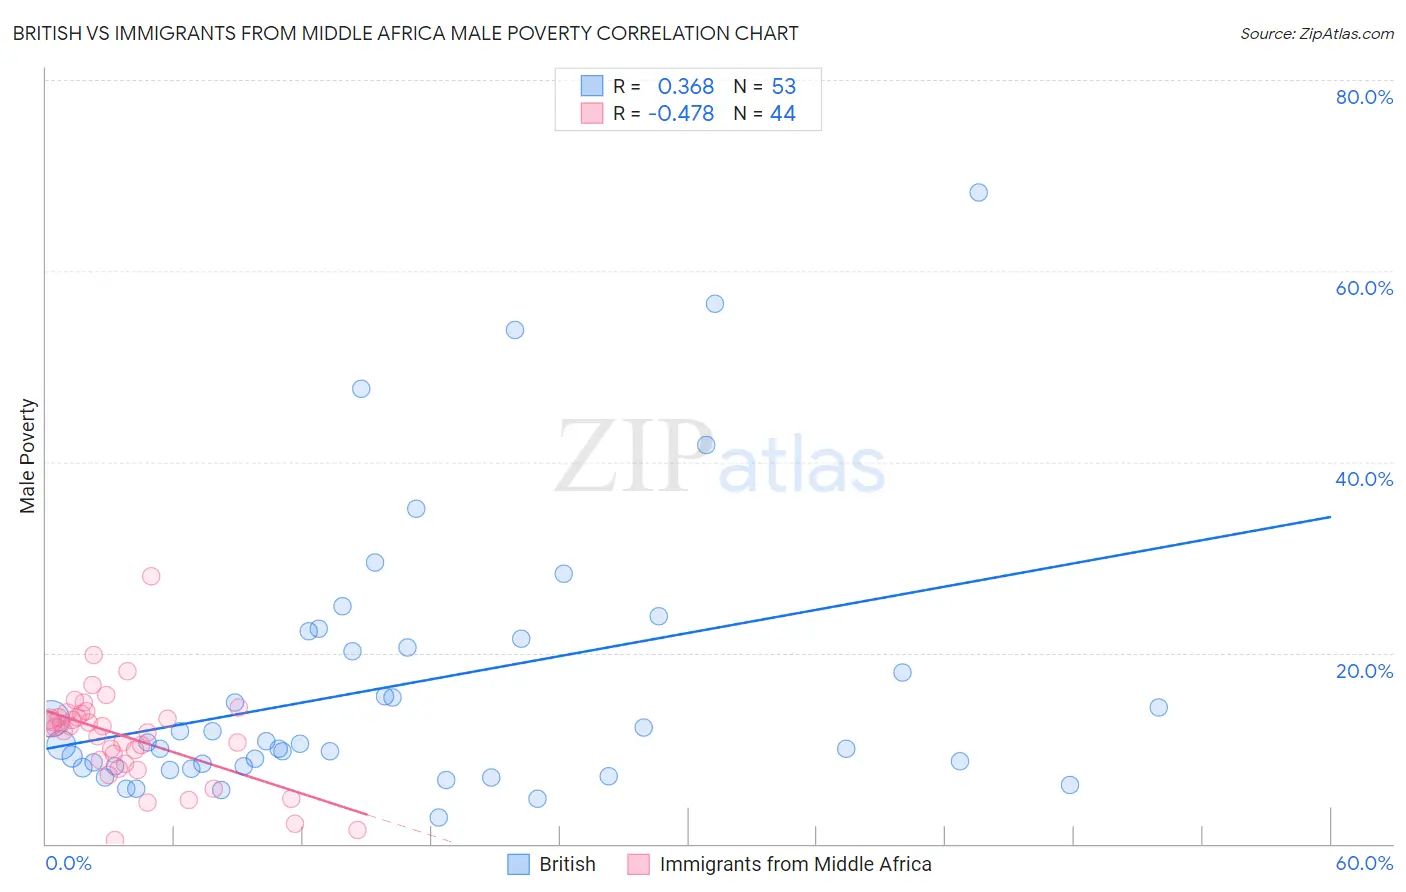
British vs Immigrants from Middle Africa Male Poverty Correlation Chart
The statistical analysis conducted on geographies consisting of 530,450,397 people shows a mild positive correlation between the proportion of British and poverty level among males in the United States with a correlation coefficient (R) of 0.368 and weighted average of 10.4%. Similarly, the statistical analysis conducted on geographies consisting of 202,607,111 people shows a moderate negative correlation between the proportion of Immigrants from Middle Africa and poverty level among males in the United States with a correlation coefficient (R) of -0.478 and weighted average of 12.7%, a difference of 22.4%.
Male Poverty Correlation Summary
| Measurement | British | Immigrants from Middle Africa |
| Minimum | 2.8% | 0.33% |
| Maximum | 68.2% | 28.0% |
| Range | 65.4% | 27.6% |
| Mean | 16.5% | 11.3% |
| Median | 10.4% | 12.3% |
| Interquartile 25% (IQ1) | 8.0% | 8.6% |
| Interquartile 75% (IQ3) | 21.0% | 13.4% |
| Interquartile Range (IQR) | 13.0% | 4.9% |
| Standard Deviation (Sample) | 14.2% | 5.0% |
| Standard Deviation (Population) | 14.0% | 4.9% |
Similar Demographics by Male Poverty
Demographics Similar to British by Male Poverty
In terms of male poverty, the demographic groups most similar to British are Indian (Asian) (10.4%, a difference of 0.070%), Immigrants from Denmark (10.4%, a difference of 0.090%), Cambodian (10.4%, a difference of 0.10%), Jordanian (10.4%, a difference of 0.20%), and Australian (10.4%, a difference of 0.20%).
| Demographics | Rating | Rank | Male Poverty |
| Czechoslovakians | 95.6 /100 | #84 | Exceptional 10.3% |
| Immigrants | England | 95.5 /100 | #85 | Exceptional 10.4% |
| Immigrants | Eastern Asia | 95.3 /100 | #86 | Exceptional 10.4% |
| Northern Europeans | 95.2 /100 | #87 | Exceptional 10.4% |
| Cambodians | 95.0 /100 | #88 | Exceptional 10.4% |
| Immigrants | Denmark | 95.0 /100 | #89 | Exceptional 10.4% |
| Indians (Asian) | 94.9 /100 | #90 | Exceptional 10.4% |
| British | 94.8 /100 | #91 | Exceptional 10.4% |
| Jordanians | 94.4 /100 | #92 | Exceptional 10.4% |
| Australians | 94.4 /100 | #93 | Exceptional 10.4% |
| Immigrants | South Africa | 94.1 /100 | #94 | Exceptional 10.4% |
| Scottish | 94.0 /100 | #95 | Exceptional 10.4% |
| Immigrants | Egypt | 93.7 /100 | #96 | Exceptional 10.4% |
| Romanians | 93.6 /100 | #97 | Exceptional 10.5% |
| Finns | 93.4 /100 | #98 | Exceptional 10.5% |
Demographics Similar to Immigrants from Middle Africa by Male Poverty
In terms of male poverty, the demographic groups most similar to Immigrants from Middle Africa are Ghanaian (12.7%, a difference of 0.27%), Ecuadorian (12.7%, a difference of 0.28%), French American Indian (12.7%, a difference of 0.31%), Immigrants from Saudi Arabia (12.7%, a difference of 0.35%), and Sudanese (12.8%, a difference of 0.36%).
| Demographics | Rating | Rank | Male Poverty |
| Fijians | 0.6 /100 | #233 | Tragic 12.6% |
| Immigrants | Armenia | 0.6 /100 | #234 | Tragic 12.6% |
| Immigrants | Laos | 0.5 /100 | #235 | Tragic 12.6% |
| Immigrants | Saudi Arabia | 0.4 /100 | #236 | Tragic 12.7% |
| French American Indians | 0.4 /100 | #237 | Tragic 12.7% |
| Ecuadorians | 0.4 /100 | #238 | Tragic 12.7% |
| Ghanaians | 0.4 /100 | #239 | Tragic 12.7% |
| Immigrants | Middle Africa | 0.4 /100 | #240 | Tragic 12.7% |
| Sudanese | 0.3 /100 | #241 | Tragic 12.8% |
| Nepalese | 0.3 /100 | #242 | Tragic 12.8% |
| Alaskan Athabascans | 0.3 /100 | #243 | Tragic 12.8% |
| Tsimshian | 0.3 /100 | #244 | Tragic 12.8% |
| Liberians | 0.3 /100 | #245 | Tragic 12.8% |
| Immigrants | El Salvador | 0.2 /100 | #246 | Tragic 12.8% |
| Immigrants | Western Africa | 0.2 /100 | #247 | Tragic 12.9% |