British vs Immigrants from Eritrea Female Unemployment
COMPARE
British
Immigrants from Eritrea
Female Unemployment
Female Unemployment Comparison
British
Immigrants from Eritrea
4.7%
FEMALE UNEMPLOYMENT
99.9/ 100
METRIC RATING
27th/ 347
METRIC RANK
5.1%
FEMALE UNEMPLOYMENT
84.6/ 100
METRIC RATING
134th/ 347
METRIC RANK
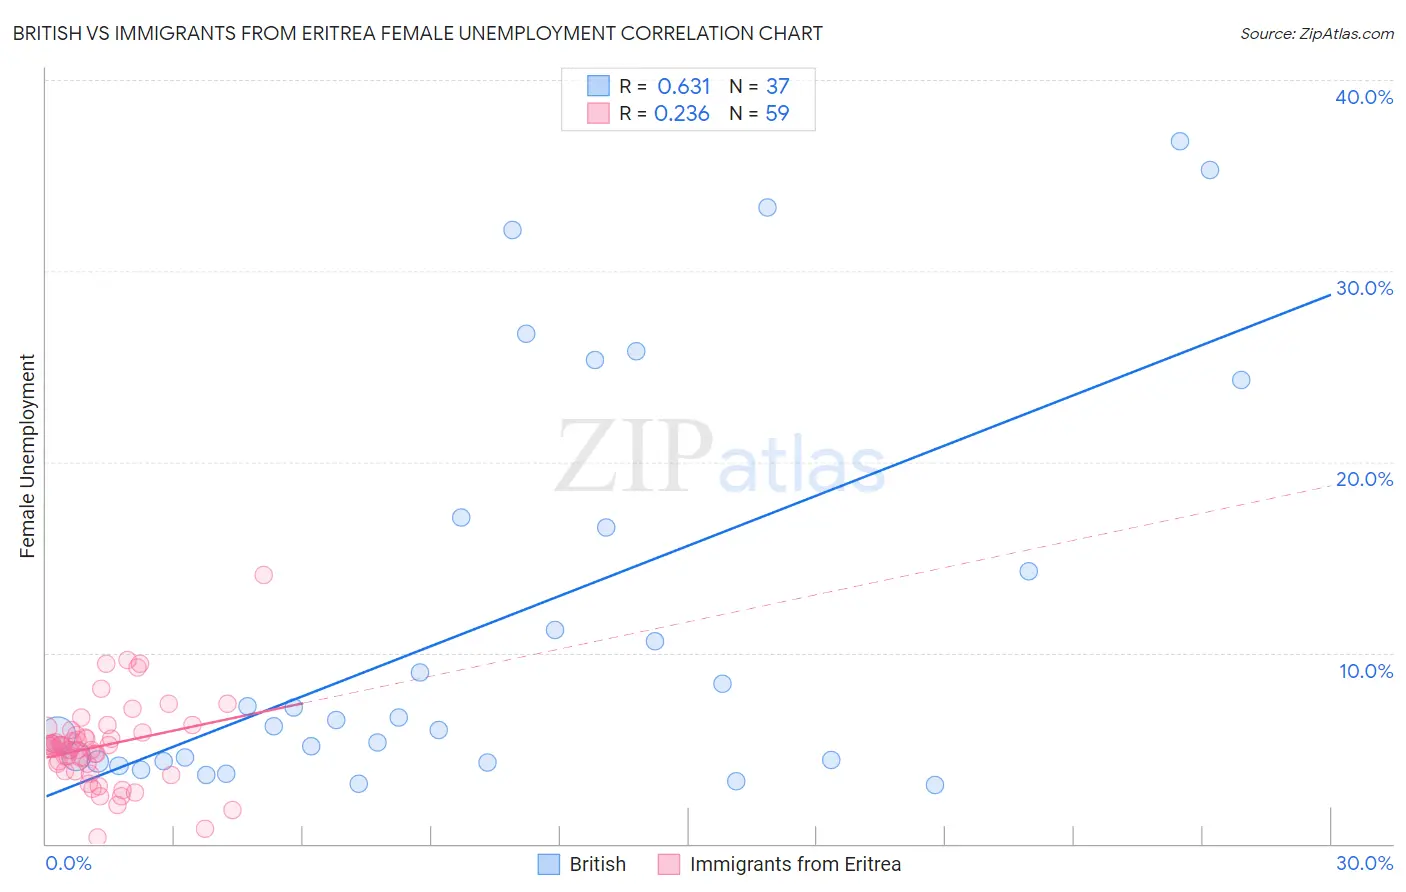
British vs Immigrants from Eritrea Female Unemployment Correlation Chart
The statistical analysis conducted on geographies consisting of 523,107,564 people shows a significant positive correlation between the proportion of British and unemploymnet rate among females in the United States with a correlation coefficient (R) of 0.631 and weighted average of 4.7%. Similarly, the statistical analysis conducted on geographies consisting of 104,834,311 people shows a weak positive correlation between the proportion of Immigrants from Eritrea and unemploymnet rate among females in the United States with a correlation coefficient (R) of 0.236 and weighted average of 5.1%, a difference of 8.2%.
Female Unemployment Correlation Summary
| Measurement | British | Immigrants from Eritrea |
| Minimum | 3.1% | 0.30% |
| Maximum | 36.8% | 14.1% |
| Range | 33.7% | 13.8% |
| Mean | 11.7% | 5.1% |
| Median | 6.5% | 5.1% |
| Interquartile 25% (IQ1) | 4.3% | 3.8% |
| Interquartile 75% (IQ3) | 16.8% | 5.8% |
| Interquartile Range (IQR) | 12.5% | 2.0% |
| Standard Deviation (Sample) | 10.5% | 2.3% |
| Standard Deviation (Population) | 10.4% | 2.2% |
Similar Demographics by Female Unemployment
Demographics Similar to British by Female Unemployment
In terms of female unemployment, the demographic groups most similar to British are Irish (4.7%, a difference of 0.030%), Cypriot (4.7%, a difference of 0.040%), Lithuanian (4.7%, a difference of 0.16%), Immigrants from Bosnia and Herzegovina (4.7%, a difference of 0.17%), and Immigrants from India (4.7%, a difference of 0.20%).
| Demographics | Rating | Rank | Female Unemployment |
| Bulgarians | 99.9 /100 | #20 | Exceptional 4.7% |
| Fijians | 99.9 /100 | #21 | Exceptional 4.7% |
| Europeans | 99.9 /100 | #22 | Exceptional 4.7% |
| Scottish | 99.9 /100 | #23 | Exceptional 4.7% |
| Welsh | 99.9 /100 | #24 | Exceptional 4.7% |
| Immigrants | India | 99.9 /100 | #25 | Exceptional 4.7% |
| Immigrants | Bosnia and Herzegovina | 99.9 /100 | #26 | Exceptional 4.7% |
| British | 99.9 /100 | #27 | Exceptional 4.7% |
| Irish | 99.9 /100 | #28 | Exceptional 4.7% |
| Cypriots | 99.9 /100 | #29 | Exceptional 4.7% |
| Lithuanians | 99.8 /100 | #30 | Exceptional 4.7% |
| Sudanese | 99.8 /100 | #31 | Exceptional 4.8% |
| Slovaks | 99.8 /100 | #32 | Exceptional 4.8% |
| Czechoslovakians | 99.7 /100 | #33 | Exceptional 4.8% |
| Zimbabweans | 99.7 /100 | #34 | Exceptional 4.8% |
Demographics Similar to Immigrants from Eritrea by Female Unemployment
In terms of female unemployment, the demographic groups most similar to Immigrants from Eritrea are Immigrants from Latvia (5.1%, a difference of 0.0%), Immigrants from Hong Kong (5.1%, a difference of 0.020%), Immigrants from Sri Lanka (5.1%, a difference of 0.040%), Indian (Asian) (5.1%, a difference of 0.050%), and Immigrants from Ethiopia (5.1%, a difference of 0.090%).
| Demographics | Rating | Rank | Female Unemployment |
| Immigrants | Hungary | 86.0 /100 | #127 | Excellent 5.1% |
| Chileans | 85.8 /100 | #128 | Excellent 5.1% |
| Ethiopians | 85.7 /100 | #129 | Excellent 5.1% |
| Maltese | 85.5 /100 | #130 | Excellent 5.1% |
| Immigrants | Ethiopia | 85.4 /100 | #131 | Excellent 5.1% |
| Immigrants | Sri Lanka | 85.0 /100 | #132 | Excellent 5.1% |
| Immigrants | Hong Kong | 84.8 /100 | #133 | Excellent 5.1% |
| Immigrants | Eritrea | 84.6 /100 | #134 | Excellent 5.1% |
| Immigrants | Latvia | 84.6 /100 | #135 | Excellent 5.1% |
| Indians (Asian) | 84.2 /100 | #136 | Excellent 5.1% |
| Pakistanis | 83.8 /100 | #137 | Excellent 5.1% |
| Chickasaw | 83.2 /100 | #138 | Excellent 5.1% |
| Immigrants | Eastern Asia | 83.0 /100 | #139 | Excellent 5.1% |
| Immigrants | France | 82.7 /100 | #140 | Excellent 5.1% |
| Immigrants | Eastern Europe | 81.5 /100 | #141 | Excellent 5.1% |