British vs Immigrants from Turkey Male Poverty
COMPARE
British
Immigrants from Turkey
Male Poverty
Male Poverty Comparison
British
Immigrants from Turkey
10.4%
MALE POVERTY
94.8/ 100
METRIC RATING
91st/ 347
METRIC RANK
10.6%
MALE POVERTY
89.5/ 100
METRIC RATING
112th/ 347
METRIC RANK
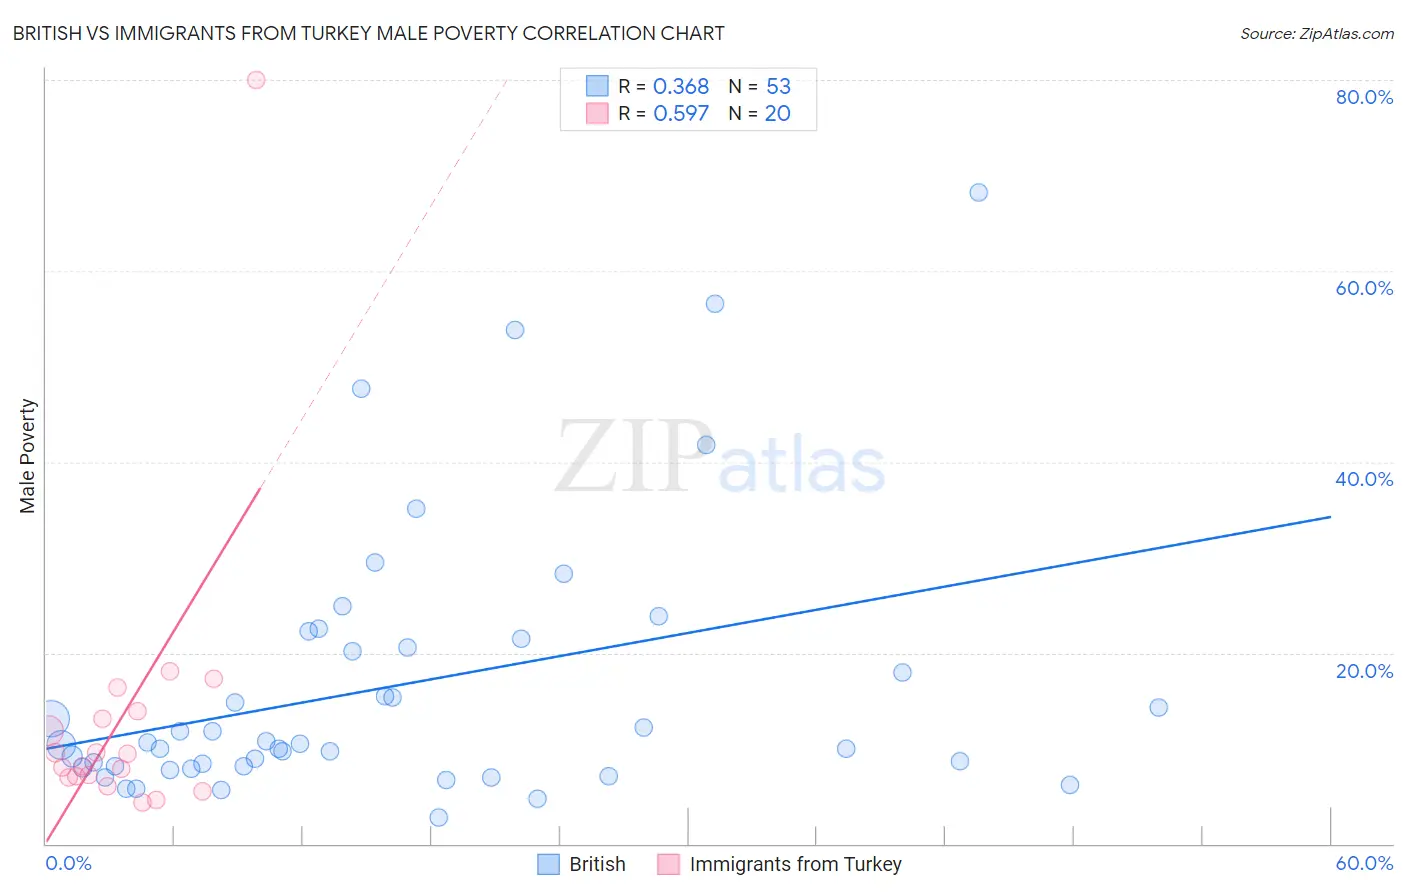
British vs Immigrants from Turkey Male Poverty Correlation Chart
The statistical analysis conducted on geographies consisting of 530,450,397 people shows a mild positive correlation between the proportion of British and poverty level among males in the United States with a correlation coefficient (R) of 0.368 and weighted average of 10.4%. Similarly, the statistical analysis conducted on geographies consisting of 222,940,059 people shows a substantial positive correlation between the proportion of Immigrants from Turkey and poverty level among males in the United States with a correlation coefficient (R) of 0.597 and weighted average of 10.6%, a difference of 2.0%.
Male Poverty Correlation Summary
| Measurement | British | Immigrants from Turkey |
| Minimum | 2.8% | 4.4% |
| Maximum | 68.2% | 80.0% |
| Range | 65.4% | 75.6% |
| Mean | 16.5% | 13.2% |
| Median | 10.4% | 8.7% |
| Interquartile 25% (IQ1) | 8.0% | 7.0% |
| Interquartile 75% (IQ3) | 21.0% | 13.5% |
| Interquartile Range (IQR) | 13.0% | 6.4% |
| Standard Deviation (Sample) | 14.2% | 16.2% |
| Standard Deviation (Population) | 14.0% | 15.8% |
Similar Demographics by Male Poverty
Demographics Similar to British by Male Poverty
In terms of male poverty, the demographic groups most similar to British are Indian (Asian) (10.4%, a difference of 0.070%), Immigrants from Denmark (10.4%, a difference of 0.090%), Cambodian (10.4%, a difference of 0.10%), Jordanian (10.4%, a difference of 0.20%), and Australian (10.4%, a difference of 0.20%).
| Demographics | Rating | Rank | Male Poverty |
| Czechoslovakians | 95.6 /100 | #84 | Exceptional 10.3% |
| Immigrants | England | 95.5 /100 | #85 | Exceptional 10.4% |
| Immigrants | Eastern Asia | 95.3 /100 | #86 | Exceptional 10.4% |
| Northern Europeans | 95.2 /100 | #87 | Exceptional 10.4% |
| Cambodians | 95.0 /100 | #88 | Exceptional 10.4% |
| Immigrants | Denmark | 95.0 /100 | #89 | Exceptional 10.4% |
| Indians (Asian) | 94.9 /100 | #90 | Exceptional 10.4% |
| British | 94.8 /100 | #91 | Exceptional 10.4% |
| Jordanians | 94.4 /100 | #92 | Exceptional 10.4% |
| Australians | 94.4 /100 | #93 | Exceptional 10.4% |
| Immigrants | South Africa | 94.1 /100 | #94 | Exceptional 10.4% |
| Scottish | 94.0 /100 | #95 | Exceptional 10.4% |
| Immigrants | Egypt | 93.7 /100 | #96 | Exceptional 10.4% |
| Romanians | 93.6 /100 | #97 | Exceptional 10.5% |
| Finns | 93.4 /100 | #98 | Exceptional 10.5% |
Demographics Similar to Immigrants from Turkey by Male Poverty
In terms of male poverty, the demographic groups most similar to Immigrants from Turkey are Immigrants from Argentina (10.6%, a difference of 0.080%), Palestinian (10.6%, a difference of 0.10%), Immigrants from Brazil (10.6%, a difference of 0.12%), Argentinean (10.6%, a difference of 0.19%), and Immigrants from Russia (10.6%, a difference of 0.24%).
| Demographics | Rating | Rank | Male Poverty |
| Canadians | 91.6 /100 | #105 | Exceptional 10.5% |
| Immigrants | Southern Europe | 91.3 /100 | #106 | Exceptional 10.5% |
| Laotians | 91.2 /100 | #107 | Exceptional 10.5% |
| Portuguese | 91.0 /100 | #108 | Exceptional 10.6% |
| Albanians | 90.6 /100 | #109 | Exceptional 10.6% |
| Argentineans | 90.1 /100 | #110 | Exceptional 10.6% |
| Immigrants | Argentina | 89.8 /100 | #111 | Excellent 10.6% |
| Immigrants | Turkey | 89.5 /100 | #112 | Excellent 10.6% |
| Palestinians | 89.1 /100 | #113 | Excellent 10.6% |
| Immigrants | Brazil | 89.0 /100 | #114 | Excellent 10.6% |
| Immigrants | Russia | 88.6 /100 | #115 | Excellent 10.6% |
| Sri Lankans | 88.1 /100 | #116 | Excellent 10.6% |
| Immigrants | South Eastern Asia | 88.1 /100 | #117 | Excellent 10.6% |
| Okinawans | 87.6 /100 | #118 | Excellent 10.7% |
| Immigrants | Hungary | 87.6 /100 | #119 | Excellent 10.7% |