Bermudan vs Immigrants from Latin America Single Female Poverty
COMPARE
Bermudan
Immigrants from Latin America
Single Female Poverty
Single Female Poverty Comparison
Bermudans
Immigrants from Latin America
22.3%
SINGLE FEMALE POVERTY
2.0/ 100
METRIC RATING
242nd/ 347
METRIC RANK
23.7%
SINGLE FEMALE POVERTY
0.0/ 100
METRIC RATING
280th/ 347
METRIC RANK
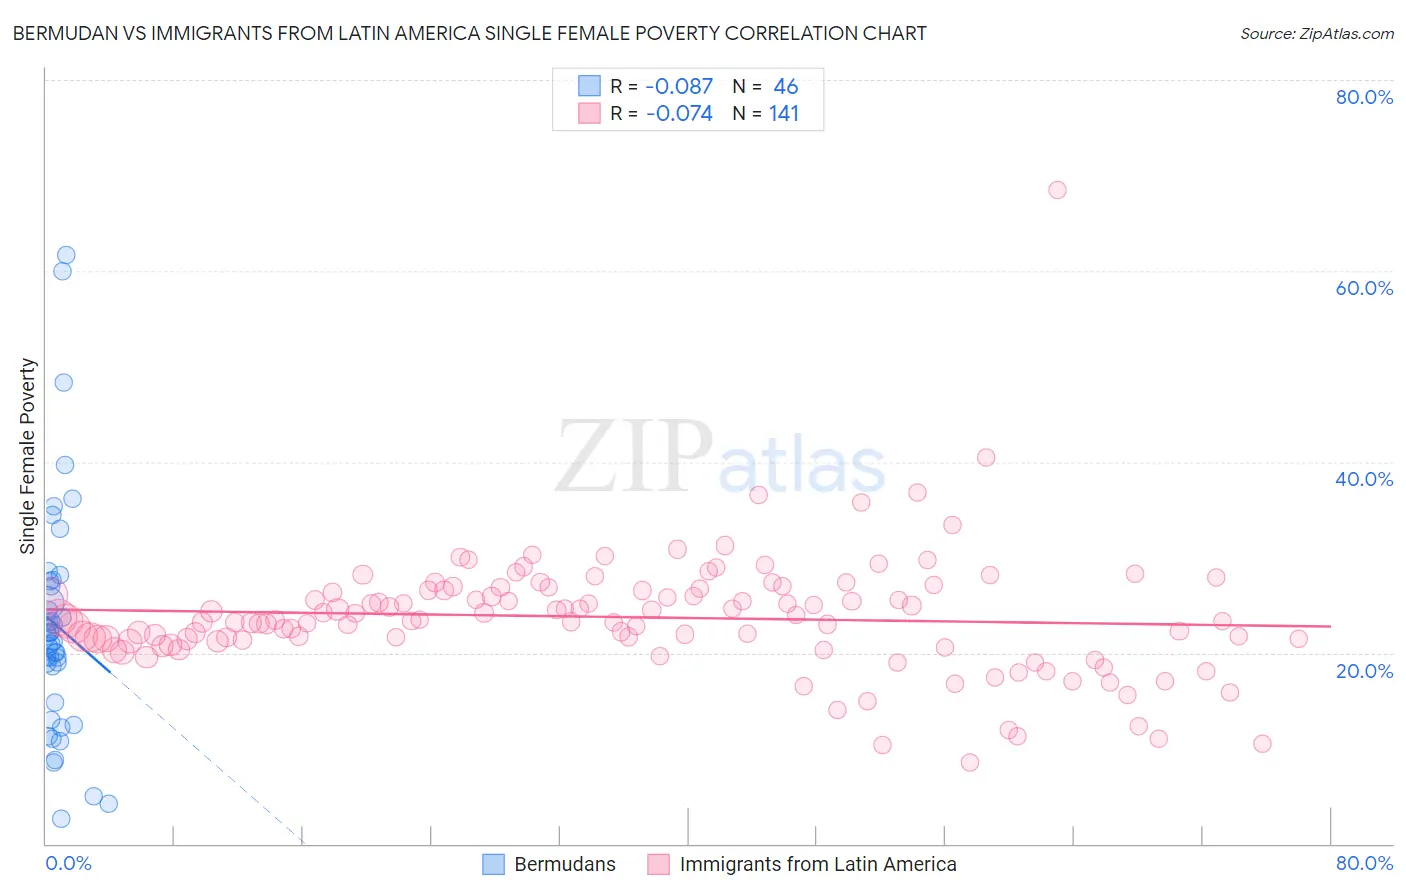
Bermudan vs Immigrants from Latin America Single Female Poverty Correlation Chart
The statistical analysis conducted on geographies consisting of 55,621,982 people shows a slight negative correlation between the proportion of Bermudans and poverty level among single females in the United States with a correlation coefficient (R) of -0.087 and weighted average of 22.3%. Similarly, the statistical analysis conducted on geographies consisting of 541,789,164 people shows a slight negative correlation between the proportion of Immigrants from Latin America and poverty level among single females in the United States with a correlation coefficient (R) of -0.074 and weighted average of 23.7%, a difference of 6.5%.
Single Female Poverty Correlation Summary
| Measurement | Bermudan | Immigrants from Latin America |
| Minimum | 2.6% | 8.5% |
| Maximum | 61.7% | 68.5% |
| Range | 59.1% | 60.0% |
| Mean | 22.9% | 23.7% |
| Median | 21.5% | 23.4% |
| Interquartile 25% (IQ1) | 14.8% | 21.3% |
| Interquartile 75% (IQ3) | 27.4% | 26.5% |
| Interquartile Range (IQR) | 12.7% | 5.2% |
| Standard Deviation (Sample) | 12.4% | 6.4% |
| Standard Deviation (Population) | 12.3% | 6.4% |
Similar Demographics by Single Female Poverty
Demographics Similar to Bermudans by Single Female Poverty
In terms of single female poverty, the demographic groups most similar to Bermudans are Cape Verdean (22.3%, a difference of 0.070%), West Indian (22.3%, a difference of 0.090%), Immigrants from Middle Africa (22.3%, a difference of 0.10%), Immigrants from Bangladesh (22.3%, a difference of 0.14%), and French (22.2%, a difference of 0.21%).
| Demographics | Rating | Rank | Single Female Poverty |
| Dutch | 4.6 /100 | #235 | Tragic 22.0% |
| Immigrants | Ecuador | 4.2 /100 | #236 | Tragic 22.0% |
| Vietnamese | 4.0 /100 | #237 | Tragic 22.0% |
| French Canadians | 2.8 /100 | #238 | Tragic 22.2% |
| Malaysians | 2.8 /100 | #239 | Tragic 22.2% |
| French | 2.3 /100 | #240 | Tragic 22.2% |
| Cape Verdeans | 2.1 /100 | #241 | Tragic 22.3% |
| Bermudans | 2.0 /100 | #242 | Tragic 22.3% |
| West Indians | 1.9 /100 | #243 | Tragic 22.3% |
| Immigrants | Middle Africa | 1.9 /100 | #244 | Tragic 22.3% |
| Immigrants | Bangladesh | 1.8 /100 | #245 | Tragic 22.3% |
| Liberians | 1.4 /100 | #246 | Tragic 22.4% |
| Immigrants | El Salvador | 1.4 /100 | #247 | Tragic 22.4% |
| Belizeans | 1.4 /100 | #248 | Tragic 22.4% |
| Immigrants | Caribbean | 1.3 /100 | #249 | Tragic 22.4% |
Demographics Similar to Immigrants from Latin America by Single Female Poverty
In terms of single female poverty, the demographic groups most similar to Immigrants from Latin America are Alaskan Athabascan (23.6%, a difference of 0.49%), Immigrants from Zaire (23.8%, a difference of 0.51%), Nonimmigrants (23.6%, a difference of 0.53%), Guatemalan (23.8%, a difference of 0.56%), and Pennsylvania German (23.6%, a difference of 0.60%).
| Demographics | Rating | Rank | Single Female Poverty |
| Alaska Natives | 0.1 /100 | #273 | Tragic 23.3% |
| Marshallese | 0.1 /100 | #274 | Tragic 23.3% |
| Mexican American Indians | 0.1 /100 | #275 | Tragic 23.4% |
| Immigrants | Azores | 0.0 /100 | #276 | Tragic 23.5% |
| Pennsylvania Germans | 0.0 /100 | #277 | Tragic 23.6% |
| Immigrants | Nonimmigrants | 0.0 /100 | #278 | Tragic 23.6% |
| Alaskan Athabascans | 0.0 /100 | #279 | Tragic 23.6% |
| Immigrants | Latin America | 0.0 /100 | #280 | Tragic 23.7% |
| Immigrants | Zaire | 0.0 /100 | #281 | Tragic 23.8% |
| Guatemalans | 0.0 /100 | #282 | Tragic 23.8% |
| German Russians | 0.0 /100 | #283 | Tragic 23.9% |
| Immigrants | Dominica | 0.0 /100 | #284 | Tragic 23.9% |
| Immigrants | Guatemala | 0.0 /100 | #285 | Tragic 24.1% |
| Cree | 0.0 /100 | #286 | Tragic 24.1% |
| Bangladeshis | 0.0 /100 | #287 | Tragic 24.2% |