Immigrants from Guatemala vs Immigrants from Latin America Single Female Poverty
COMPARE
Immigrants from Guatemala
Immigrants from Latin America
Single Female Poverty
Single Female Poverty Comparison
Immigrants from Guatemala
Immigrants from Latin America
24.1%
SINGLE FEMALE POVERTY
0.0/ 100
METRIC RATING
285th/ 347
METRIC RANK
23.7%
SINGLE FEMALE POVERTY
0.0/ 100
METRIC RATING
280th/ 347
METRIC RANK
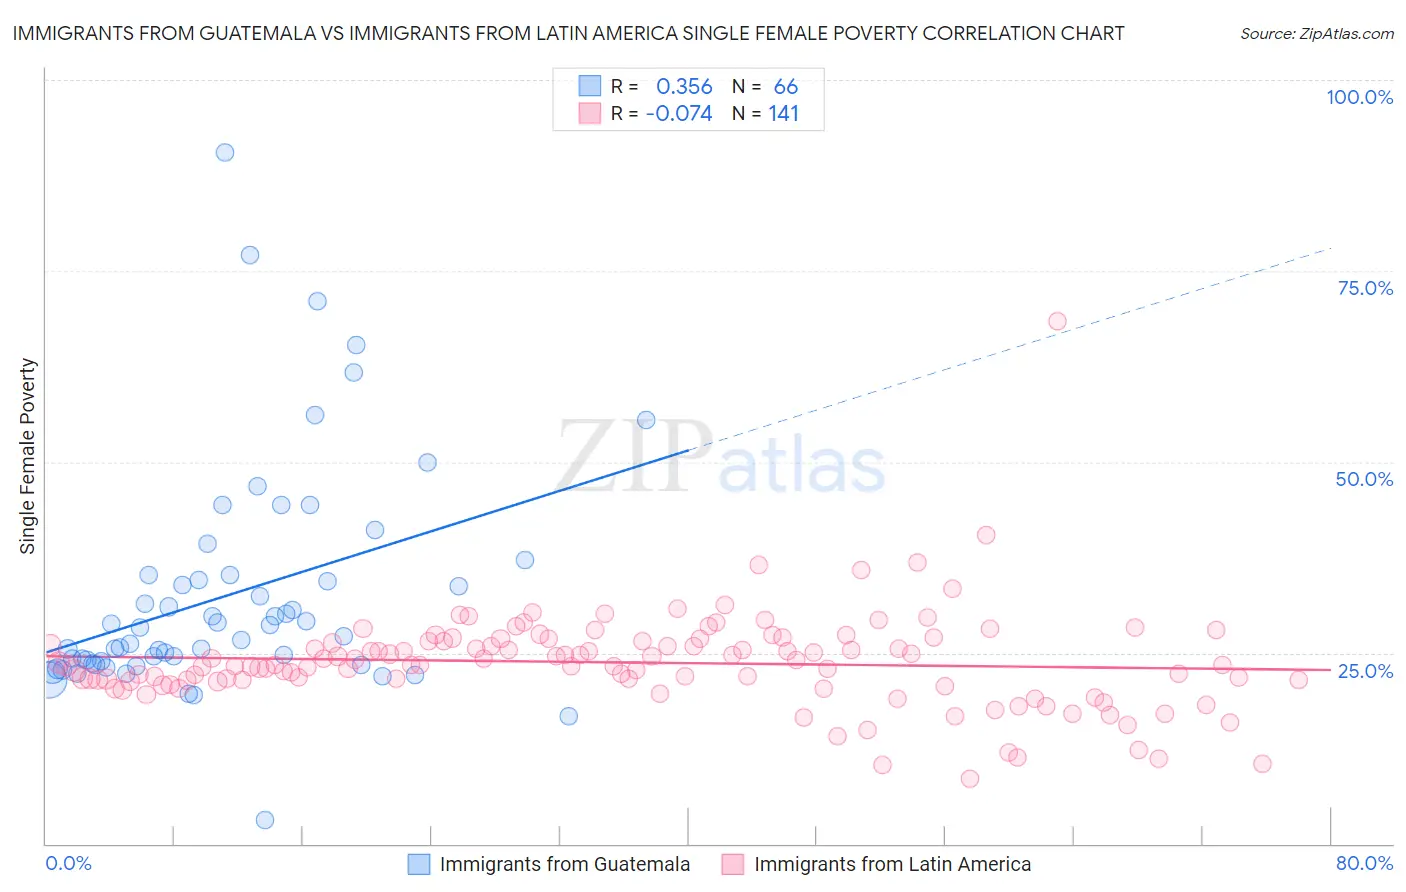
Immigrants from Guatemala vs Immigrants from Latin America Single Female Poverty Correlation Chart
The statistical analysis conducted on geographies consisting of 373,364,568 people shows a mild positive correlation between the proportion of Immigrants from Guatemala and poverty level among single females in the United States with a correlation coefficient (R) of 0.356 and weighted average of 24.1%. Similarly, the statistical analysis conducted on geographies consisting of 541,789,164 people shows a slight negative correlation between the proportion of Immigrants from Latin America and poverty level among single females in the United States with a correlation coefficient (R) of -0.074 and weighted average of 23.7%, a difference of 1.7%.
Single Female Poverty Correlation Summary
| Measurement | Immigrants from Guatemala | Immigrants from Latin America |
| Minimum | 3.0% | 8.5% |
| Maximum | 90.5% | 68.5% |
| Range | 87.4% | 60.0% |
| Mean | 32.5% | 23.7% |
| Median | 27.7% | 23.4% |
| Interquartile 25% (IQ1) | 23.6% | 21.3% |
| Interquartile 75% (IQ3) | 35.1% | 26.5% |
| Interquartile Range (IQR) | 11.5% | 5.2% |
| Standard Deviation (Sample) | 15.0% | 6.4% |
| Standard Deviation (Population) | 14.9% | 6.4% |
Demographics Similar to Immigrants from Guatemala and Immigrants from Latin America by Single Female Poverty
In terms of single female poverty, the demographic groups most similar to Immigrants from Guatemala are Cree (24.1%, a difference of 0.040%), Bangladeshi (24.2%, a difference of 0.19%), Spanish American (24.2%, a difference of 0.21%), U.S. Virgin Islander (24.2%, a difference of 0.26%), and Indonesian (24.3%, a difference of 0.60%). Similarly, the demographic groups most similar to Immigrants from Latin America are Alaskan Athabascan (23.6%, a difference of 0.49%), Immigrants from Zaire (23.8%, a difference of 0.51%), Nonimmigrants (23.6%, a difference of 0.53%), Guatemalan (23.8%, a difference of 0.56%), and Pennsylvania German (23.6%, a difference of 0.60%).
| Demographics | Rating | Rank | Single Female Poverty |
| Immigrants | Senegal | 0.1 /100 | #272 | Tragic 23.2% |
| Alaska Natives | 0.1 /100 | #273 | Tragic 23.3% |
| Marshallese | 0.1 /100 | #274 | Tragic 23.3% |
| Mexican American Indians | 0.1 /100 | #275 | Tragic 23.4% |
| Immigrants | Azores | 0.0 /100 | #276 | Tragic 23.5% |
| Pennsylvania Germans | 0.0 /100 | #277 | Tragic 23.6% |
| Immigrants | Nonimmigrants | 0.0 /100 | #278 | Tragic 23.6% |
| Alaskan Athabascans | 0.0 /100 | #279 | Tragic 23.6% |
| Immigrants | Latin America | 0.0 /100 | #280 | Tragic 23.7% |
| Immigrants | Zaire | 0.0 /100 | #281 | Tragic 23.8% |
| Guatemalans | 0.0 /100 | #282 | Tragic 23.8% |
| German Russians | 0.0 /100 | #283 | Tragic 23.9% |
| Immigrants | Dominica | 0.0 /100 | #284 | Tragic 23.9% |
| Immigrants | Guatemala | 0.0 /100 | #285 | Tragic 24.1% |
| Cree | 0.0 /100 | #286 | Tragic 24.1% |
| Bangladeshis | 0.0 /100 | #287 | Tragic 24.2% |
| Spanish Americans | 0.0 /100 | #288 | Tragic 24.2% |
| U.S. Virgin Islanders | 0.0 /100 | #289 | Tragic 24.2% |
| Indonesians | 0.0 /100 | #290 | Tragic 24.3% |
| Osage | 0.0 /100 | #291 | Tragic 24.4% |
| Alsatians | 0.0 /100 | #292 | Tragic 24.5% |