Bermudan vs Samoan Single Female Poverty
COMPARE
Bermudan
Samoan
Single Female Poverty
Single Female Poverty Comparison
Bermudans
Samoans
22.3%
SINGLE FEMALE POVERTY
2.0/ 100
METRIC RATING
242nd/ 347
METRIC RANK
20.6%
SINGLE FEMALE POVERTY
76.0/ 100
METRIC RATING
155th/ 347
METRIC RANK
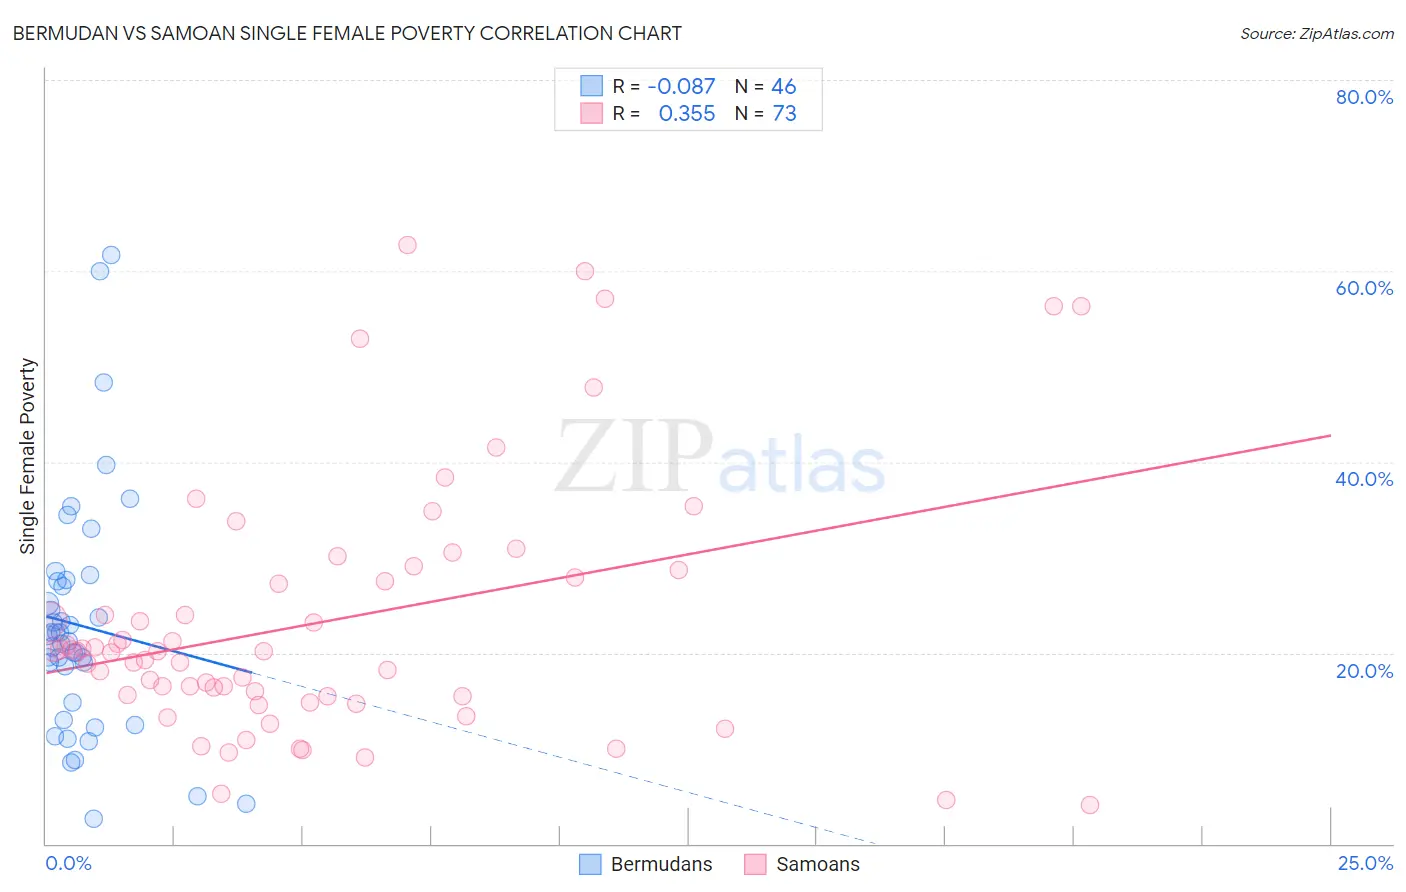
Bermudan vs Samoan Single Female Poverty Correlation Chart
The statistical analysis conducted on geographies consisting of 55,621,982 people shows a slight negative correlation between the proportion of Bermudans and poverty level among single females in the United States with a correlation coefficient (R) of -0.087 and weighted average of 22.3%. Similarly, the statistical analysis conducted on geographies consisting of 223,791,038 people shows a mild positive correlation between the proportion of Samoans and poverty level among single females in the United States with a correlation coefficient (R) of 0.355 and weighted average of 20.6%, a difference of 8.0%.
Single Female Poverty Correlation Summary
| Measurement | Bermudan | Samoan |
| Minimum | 2.6% | 4.0% |
| Maximum | 61.7% | 62.7% |
| Range | 59.1% | 58.7% |
| Mean | 22.9% | 23.3% |
| Median | 21.5% | 20.1% |
| Interquartile 25% (IQ1) | 14.8% | 15.4% |
| Interquartile 75% (IQ3) | 27.4% | 28.3% |
| Interquartile Range (IQR) | 12.7% | 12.9% |
| Standard Deviation (Sample) | 12.4% | 13.3% |
| Standard Deviation (Population) | 12.3% | 13.2% |
Similar Demographics by Single Female Poverty
Demographics Similar to Bermudans by Single Female Poverty
In terms of single female poverty, the demographic groups most similar to Bermudans are Cape Verdean (22.3%, a difference of 0.070%), West Indian (22.3%, a difference of 0.090%), Immigrants from Middle Africa (22.3%, a difference of 0.10%), Immigrants from Bangladesh (22.3%, a difference of 0.14%), and French (22.2%, a difference of 0.21%).
| Demographics | Rating | Rank | Single Female Poverty |
| Dutch | 4.6 /100 | #235 | Tragic 22.0% |
| Immigrants | Ecuador | 4.2 /100 | #236 | Tragic 22.0% |
| Vietnamese | 4.0 /100 | #237 | Tragic 22.0% |
| French Canadians | 2.8 /100 | #238 | Tragic 22.2% |
| Malaysians | 2.8 /100 | #239 | Tragic 22.2% |
| French | 2.3 /100 | #240 | Tragic 22.2% |
| Cape Verdeans | 2.1 /100 | #241 | Tragic 22.3% |
| Bermudans | 2.0 /100 | #242 | Tragic 22.3% |
| West Indians | 1.9 /100 | #243 | Tragic 22.3% |
| Immigrants | Middle Africa | 1.9 /100 | #244 | Tragic 22.3% |
| Immigrants | Bangladesh | 1.8 /100 | #245 | Tragic 22.3% |
| Liberians | 1.4 /100 | #246 | Tragic 22.4% |
| Immigrants | El Salvador | 1.4 /100 | #247 | Tragic 22.4% |
| Belizeans | 1.4 /100 | #248 | Tragic 22.4% |
| Immigrants | Caribbean | 1.3 /100 | #249 | Tragic 22.4% |
Demographics Similar to Samoans by Single Female Poverty
In terms of single female poverty, the demographic groups most similar to Samoans are South American Indian (20.6%, a difference of 0.030%), Immigrants from Western Europe (20.6%, a difference of 0.060%), Swedish (20.6%, a difference of 0.10%), Immigrants from Uruguay (20.6%, a difference of 0.15%), and Immigrants from Oceania (20.7%, a difference of 0.15%).
| Demographics | Rating | Rank | Single Female Poverty |
| Luxembourgers | 84.9 /100 | #148 | Excellent 20.4% |
| Portuguese | 81.5 /100 | #149 | Excellent 20.5% |
| Immigrants | Denmark | 80.5 /100 | #150 | Excellent 20.5% |
| Puget Sound Salish | 79.6 /100 | #151 | Good 20.6% |
| Immigrants | Uruguay | 77.7 /100 | #152 | Good 20.6% |
| Swedes | 77.1 /100 | #153 | Good 20.6% |
| Immigrants | Western Europe | 76.7 /100 | #154 | Good 20.6% |
| Samoans | 76.0 /100 | #155 | Good 20.6% |
| South American Indians | 75.7 /100 | #156 | Good 20.6% |
| Immigrants | Oceania | 74.3 /100 | #157 | Good 20.7% |
| Danes | 73.0 /100 | #158 | Good 20.7% |
| Costa Ricans | 71.8 /100 | #159 | Good 20.7% |
| Arabs | 70.8 /100 | #160 | Good 20.7% |
| Kenyans | 68.5 /100 | #161 | Good 20.8% |
| Northern Europeans | 68.4 /100 | #162 | Good 20.8% |