Mexican vs Immigrants from Latin America Single Female Poverty
COMPARE
Mexican
Immigrants from Latin America
Single Female Poverty
Single Female Poverty Comparison
Mexicans
Immigrants from Latin America
25.0%
SINGLE FEMALE POVERTY
0.0/ 100
METRIC RATING
299th/ 347
METRIC RANK
23.7%
SINGLE FEMALE POVERTY
0.0/ 100
METRIC RATING
280th/ 347
METRIC RANK
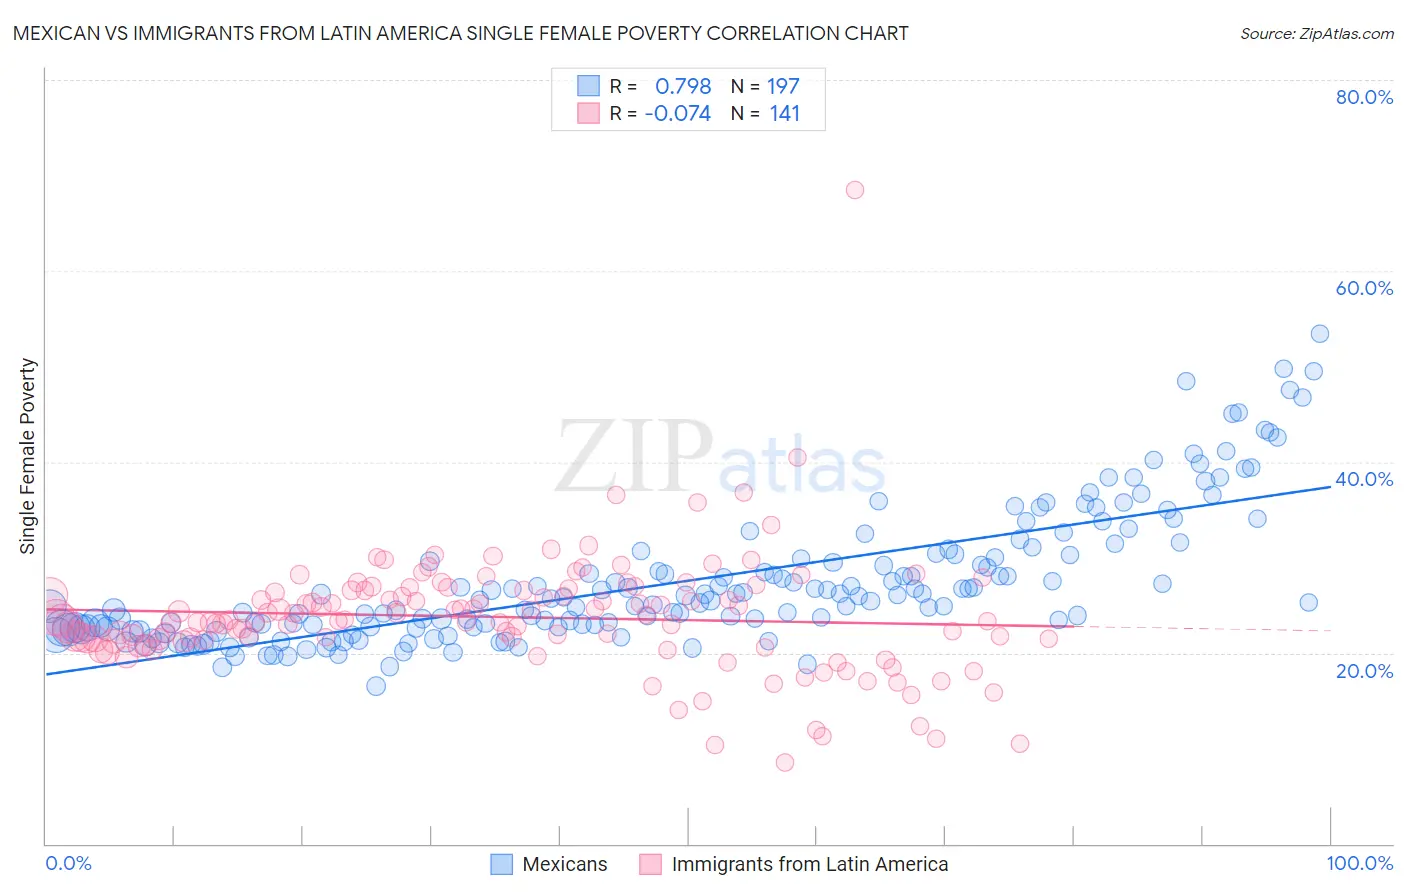
Mexican vs Immigrants from Latin America Single Female Poverty Correlation Chart
The statistical analysis conducted on geographies consisting of 547,731,472 people shows a strong positive correlation between the proportion of Mexicans and poverty level among single females in the United States with a correlation coefficient (R) of 0.798 and weighted average of 25.0%. Similarly, the statistical analysis conducted on geographies consisting of 541,789,164 people shows a slight negative correlation between the proportion of Immigrants from Latin America and poverty level among single females in the United States with a correlation coefficient (R) of -0.074 and weighted average of 23.7%, a difference of 5.6%.
Single Female Poverty Correlation Summary
| Measurement | Mexican | Immigrants from Latin America |
| Minimum | 16.6% | 8.5% |
| Maximum | 53.5% | 68.5% |
| Range | 36.9% | 60.0% |
| Mean | 27.4% | 23.7% |
| Median | 25.5% | 23.4% |
| Interquartile 25% (IQ1) | 22.6% | 21.3% |
| Interquartile 75% (IQ3) | 30.1% | 26.5% |
| Interquartile Range (IQR) | 7.5% | 5.2% |
| Standard Deviation (Sample) | 7.0% | 6.4% |
| Standard Deviation (Population) | 7.0% | 6.4% |
Demographics Similar to Mexicans and Immigrants from Latin America by Single Female Poverty
In terms of single female poverty, the demographic groups most similar to Mexicans are Yaqui (24.9%, a difference of 0.67%), Immigrants from Central America (24.8%, a difference of 0.86%), African (24.8%, a difference of 1.1%), Hispanic or Latino (24.6%, a difference of 1.6%), and French American Indian (24.6%, a difference of 2.0%). Similarly, the demographic groups most similar to Immigrants from Latin America are Alaskan Athabascan (23.6%, a difference of 0.49%), Immigrants from Zaire (23.8%, a difference of 0.51%), Guatemalan (23.8%, a difference of 0.56%), German Russian (23.9%, a difference of 0.71%), and Immigrants from Dominica (23.9%, a difference of 0.82%).
| Demographics | Rating | Rank | Single Female Poverty |
| Alaskan Athabascans | 0.0 /100 | #279 | Tragic 23.6% |
| Immigrants | Latin America | 0.0 /100 | #280 | Tragic 23.7% |
| Immigrants | Zaire | 0.0 /100 | #281 | Tragic 23.8% |
| Guatemalans | 0.0 /100 | #282 | Tragic 23.8% |
| German Russians | 0.0 /100 | #283 | Tragic 23.9% |
| Immigrants | Dominica | 0.0 /100 | #284 | Tragic 23.9% |
| Immigrants | Guatemala | 0.0 /100 | #285 | Tragic 24.1% |
| Cree | 0.0 /100 | #286 | Tragic 24.1% |
| Bangladeshis | 0.0 /100 | #287 | Tragic 24.2% |
| Spanish Americans | 0.0 /100 | #288 | Tragic 24.2% |
| U.S. Virgin Islanders | 0.0 /100 | #289 | Tragic 24.2% |
| Indonesians | 0.0 /100 | #290 | Tragic 24.3% |
| Osage | 0.0 /100 | #291 | Tragic 24.4% |
| Alsatians | 0.0 /100 | #292 | Tragic 24.5% |
| Americans | 0.0 /100 | #293 | Tragic 24.5% |
| French American Indians | 0.0 /100 | #294 | Tragic 24.6% |
| Hispanics or Latinos | 0.0 /100 | #295 | Tragic 24.6% |
| Africans | 0.0 /100 | #296 | Tragic 24.8% |
| Immigrants | Central America | 0.0 /100 | #297 | Tragic 24.8% |
| Yaqui | 0.0 /100 | #298 | Tragic 24.9% |
| Mexicans | 0.0 /100 | #299 | Tragic 25.0% |