Thai vs Immigrants from Latin America Single Female Poverty
COMPARE
Thai
Immigrants from Latin America
Single Female Poverty
Single Female Poverty Comparison
Thais
Immigrants from Latin America
17.3%
SINGLE FEMALE POVERTY
100.0/ 100
METRIC RATING
7th/ 347
METRIC RANK
23.7%
SINGLE FEMALE POVERTY
0.0/ 100
METRIC RATING
280th/ 347
METRIC RANK
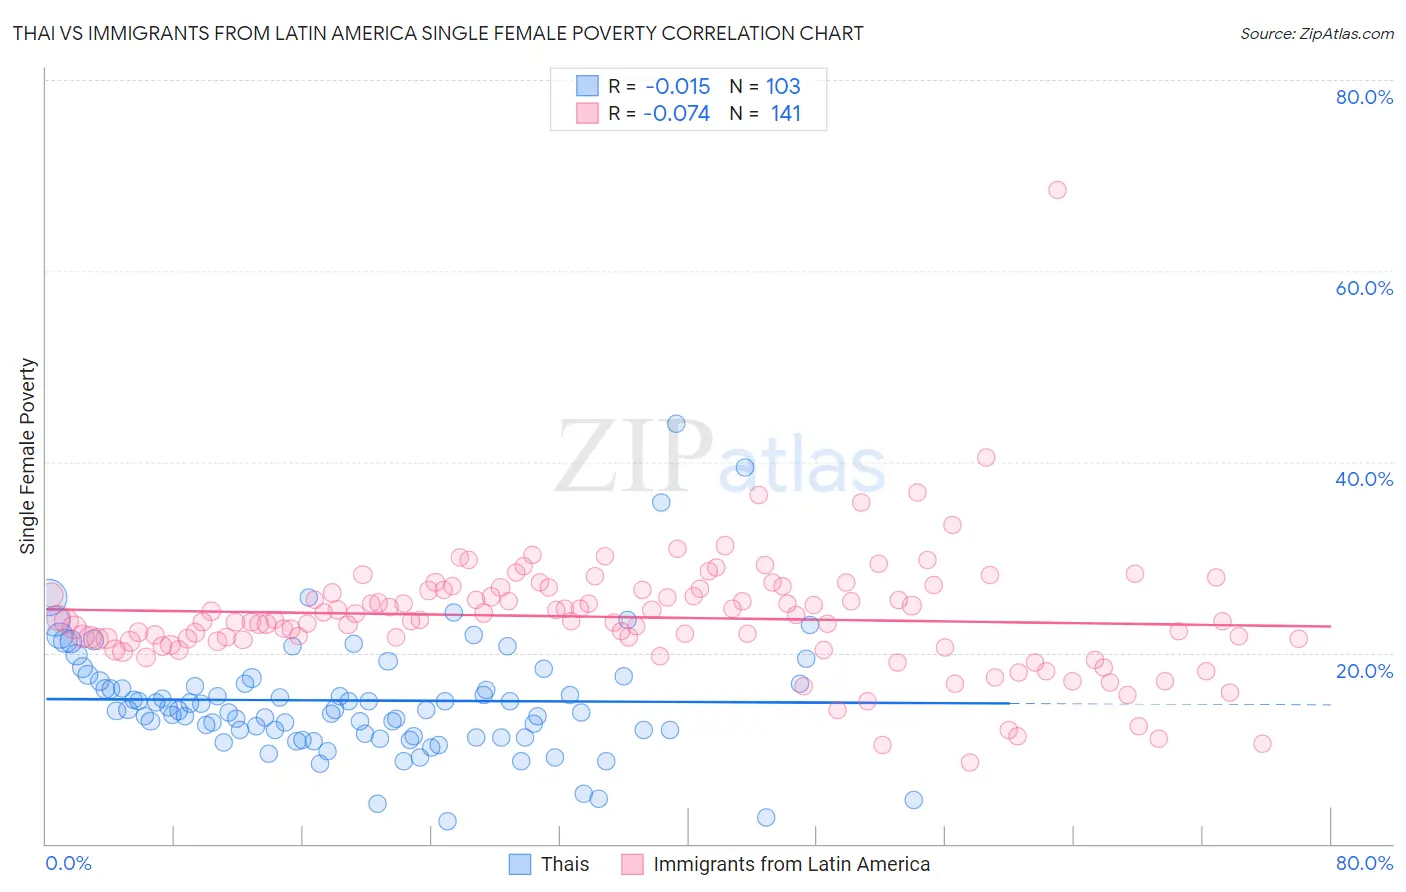
Thai vs Immigrants from Latin America Single Female Poverty Correlation Chart
The statistical analysis conducted on geographies consisting of 465,874,007 people shows no correlation between the proportion of Thais and poverty level among single females in the United States with a correlation coefficient (R) of -0.015 and weighted average of 17.3%. Similarly, the statistical analysis conducted on geographies consisting of 541,789,164 people shows a slight negative correlation between the proportion of Immigrants from Latin America and poverty level among single females in the United States with a correlation coefficient (R) of -0.074 and weighted average of 23.7%, a difference of 37.2%.
Single Female Poverty Correlation Summary
| Measurement | Thai | Immigrants from Latin America |
| Minimum | 2.4% | 8.5% |
| Maximum | 44.0% | 68.5% |
| Range | 41.7% | 60.0% |
| Mean | 15.0% | 23.7% |
| Median | 13.9% | 23.4% |
| Interquartile 25% (IQ1) | 11.3% | 21.3% |
| Interquartile 75% (IQ3) | 17.1% | 26.5% |
| Interquartile Range (IQR) | 5.8% | 5.2% |
| Standard Deviation (Sample) | 6.4% | 6.4% |
| Standard Deviation (Population) | 6.4% | 6.4% |
Similar Demographics by Single Female Poverty
Demographics Similar to Thais by Single Female Poverty
In terms of single female poverty, the demographic groups most similar to Thais are Immigrants from Iran (17.5%, a difference of 0.99%), Filipino (17.0%, a difference of 1.7%), Assyrian/Chaldean/Syriac (17.0%, a difference of 1.9%), Bhutanese (17.7%, a difference of 2.4%), and Immigrants from India (16.8%, a difference of 2.8%).
| Demographics | Rating | Rank | Single Female Poverty |
| Chinese | 100.0 /100 | #1 | Exceptional 16.1% |
| Immigrants | Taiwan | 100.0 /100 | #2 | Exceptional 16.4% |
| Immigrants | Hong Kong | 100.0 /100 | #3 | Exceptional 16.5% |
| Immigrants | India | 100.0 /100 | #4 | Exceptional 16.8% |
| Assyrians/Chaldeans/Syriacs | 100.0 /100 | #5 | Exceptional 17.0% |
| Filipinos | 100.0 /100 | #6 | Exceptional 17.0% |
| Thais | 100.0 /100 | #7 | Exceptional 17.3% |
| Immigrants | Iran | 100.0 /100 | #8 | Exceptional 17.5% |
| Bhutanese | 100.0 /100 | #9 | Exceptional 17.7% |
| Immigrants | Ireland | 100.0 /100 | #10 | Exceptional 17.8% |
| Immigrants | Lithuania | 100.0 /100 | #11 | Exceptional 17.8% |
| Immigrants | South Central Asia | 100.0 /100 | #12 | Exceptional 17.8% |
| Immigrants | Bolivia | 100.0 /100 | #13 | Exceptional 17.8% |
| Bolivians | 100.0 /100 | #14 | Exceptional 17.9% |
| Indians (Asian) | 100.0 /100 | #15 | Exceptional 17.9% |
Demographics Similar to Immigrants from Latin America by Single Female Poverty
In terms of single female poverty, the demographic groups most similar to Immigrants from Latin America are Alaskan Athabascan (23.6%, a difference of 0.49%), Immigrants from Zaire (23.8%, a difference of 0.51%), Nonimmigrants (23.6%, a difference of 0.53%), Guatemalan (23.8%, a difference of 0.56%), and Pennsylvania German (23.6%, a difference of 0.60%).
| Demographics | Rating | Rank | Single Female Poverty |
| Alaska Natives | 0.1 /100 | #273 | Tragic 23.3% |
| Marshallese | 0.1 /100 | #274 | Tragic 23.3% |
| Mexican American Indians | 0.1 /100 | #275 | Tragic 23.4% |
| Immigrants | Azores | 0.0 /100 | #276 | Tragic 23.5% |
| Pennsylvania Germans | 0.0 /100 | #277 | Tragic 23.6% |
| Immigrants | Nonimmigrants | 0.0 /100 | #278 | Tragic 23.6% |
| Alaskan Athabascans | 0.0 /100 | #279 | Tragic 23.6% |
| Immigrants | Latin America | 0.0 /100 | #280 | Tragic 23.7% |
| Immigrants | Zaire | 0.0 /100 | #281 | Tragic 23.8% |
| Guatemalans | 0.0 /100 | #282 | Tragic 23.8% |
| German Russians | 0.0 /100 | #283 | Tragic 23.9% |
| Immigrants | Dominica | 0.0 /100 | #284 | Tragic 23.9% |
| Immigrants | Guatemala | 0.0 /100 | #285 | Tragic 24.1% |
| Cree | 0.0 /100 | #286 | Tragic 24.1% |
| Bangladeshis | 0.0 /100 | #287 | Tragic 24.2% |