Bermudan vs Immigrants from Northern Europe Single Female Poverty
COMPARE
Bermudan
Immigrants from Northern Europe
Single Female Poverty
Single Female Poverty Comparison
Bermudans
Immigrants from Northern Europe
22.3%
SINGLE FEMALE POVERTY
2.0/ 100
METRIC RATING
242nd/ 347
METRIC RANK
19.2%
SINGLE FEMALE POVERTY
99.6/ 100
METRIC RATING
63rd/ 347
METRIC RANK
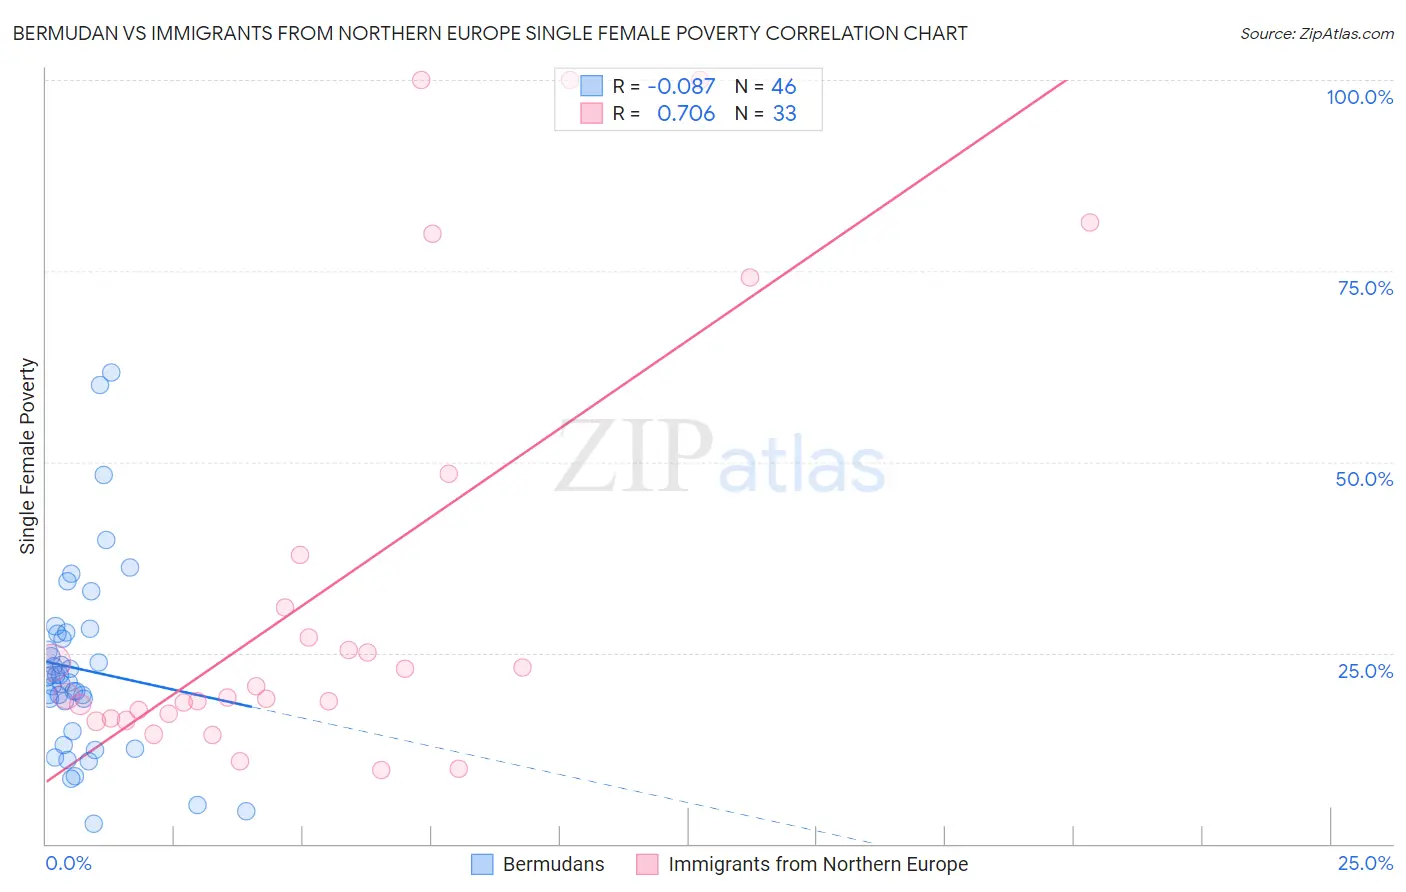
Bermudan vs Immigrants from Northern Europe Single Female Poverty Correlation Chart
The statistical analysis conducted on geographies consisting of 55,621,982 people shows a slight negative correlation between the proportion of Bermudans and poverty level among single females in the United States with a correlation coefficient (R) of -0.087 and weighted average of 22.3%. Similarly, the statistical analysis conducted on geographies consisting of 465,326,322 people shows a strong positive correlation between the proportion of Immigrants from Northern Europe and poverty level among single females in the United States with a correlation coefficient (R) of 0.706 and weighted average of 19.2%, a difference of 15.9%.
Single Female Poverty Correlation Summary
| Measurement | Bermudan | Immigrants from Northern Europe |
| Minimum | 2.6% | 9.6% |
| Maximum | 61.7% | 100.0% |
| Range | 59.1% | 90.4% |
| Mean | 22.9% | 33.1% |
| Median | 21.5% | 19.3% |
| Interquartile 25% (IQ1) | 14.8% | 16.7% |
| Interquartile 75% (IQ3) | 27.4% | 34.4% |
| Interquartile Range (IQR) | 12.7% | 17.6% |
| Standard Deviation (Sample) | 12.4% | 28.3% |
| Standard Deviation (Population) | 12.3% | 27.9% |
Similar Demographics by Single Female Poverty
Demographics Similar to Bermudans by Single Female Poverty
In terms of single female poverty, the demographic groups most similar to Bermudans are Cape Verdean (22.3%, a difference of 0.070%), West Indian (22.3%, a difference of 0.090%), Immigrants from Middle Africa (22.3%, a difference of 0.10%), Immigrants from Bangladesh (22.3%, a difference of 0.14%), and French (22.2%, a difference of 0.21%).
| Demographics | Rating | Rank | Single Female Poverty |
| Dutch | 4.6 /100 | #235 | Tragic 22.0% |
| Immigrants | Ecuador | 4.2 /100 | #236 | Tragic 22.0% |
| Vietnamese | 4.0 /100 | #237 | Tragic 22.0% |
| French Canadians | 2.8 /100 | #238 | Tragic 22.2% |
| Malaysians | 2.8 /100 | #239 | Tragic 22.2% |
| French | 2.3 /100 | #240 | Tragic 22.2% |
| Cape Verdeans | 2.1 /100 | #241 | Tragic 22.3% |
| Bermudans | 2.0 /100 | #242 | Tragic 22.3% |
| West Indians | 1.9 /100 | #243 | Tragic 22.3% |
| Immigrants | Middle Africa | 1.9 /100 | #244 | Tragic 22.3% |
| Immigrants | Bangladesh | 1.8 /100 | #245 | Tragic 22.3% |
| Liberians | 1.4 /100 | #246 | Tragic 22.4% |
| Immigrants | El Salvador | 1.4 /100 | #247 | Tragic 22.4% |
| Belizeans | 1.4 /100 | #248 | Tragic 22.4% |
| Immigrants | Caribbean | 1.3 /100 | #249 | Tragic 22.4% |
Demographics Similar to Immigrants from Northern Europe by Single Female Poverty
In terms of single female poverty, the demographic groups most similar to Immigrants from Northern Europe are Immigrants from Europe (19.2%, a difference of 0.0%), Cypriot (19.2%, a difference of 0.030%), Palestinian (19.2%, a difference of 0.050%), Immigrants from Egypt (19.2%, a difference of 0.090%), and Lithuanian (19.2%, a difference of 0.12%).
| Demographics | Rating | Rank | Single Female Poverty |
| Immigrants | Fiji | 99.7 /100 | #56 | Exceptional 19.1% |
| Eastern Europeans | 99.7 /100 | #57 | Exceptional 19.1% |
| Immigrants | Bulgaria | 99.7 /100 | #58 | Exceptional 19.1% |
| Sri Lankans | 99.6 /100 | #59 | Exceptional 19.2% |
| Russians | 99.6 /100 | #60 | Exceptional 19.2% |
| Cambodians | 99.6 /100 | #61 | Exceptional 19.2% |
| Lithuanians | 99.6 /100 | #62 | Exceptional 19.2% |
| Immigrants | Northern Europe | 99.6 /100 | #63 | Exceptional 19.2% |
| Immigrants | Europe | 99.6 /100 | #64 | Exceptional 19.2% |
| Cypriots | 99.6 /100 | #65 | Exceptional 19.2% |
| Palestinians | 99.6 /100 | #66 | Exceptional 19.2% |
| Immigrants | Egypt | 99.6 /100 | #67 | Exceptional 19.2% |
| Laotians | 99.5 /100 | #68 | Exceptional 19.3% |
| Paraguayans | 99.5 /100 | #69 | Exceptional 19.3% |
| Immigrants | Jordan | 99.4 /100 | #70 | Exceptional 19.3% |