Portuguese vs Immigrants from Denmark Single Female Poverty
COMPARE
Portuguese
Immigrants from Denmark
Single Female Poverty
Single Female Poverty Comparison
Portuguese
Immigrants from Denmark
20.5%
SINGLE FEMALE POVERTY
81.5/ 100
METRIC RATING
149th/ 347
METRIC RANK
20.5%
SINGLE FEMALE POVERTY
80.5/ 100
METRIC RATING
150th/ 347
METRIC RANK
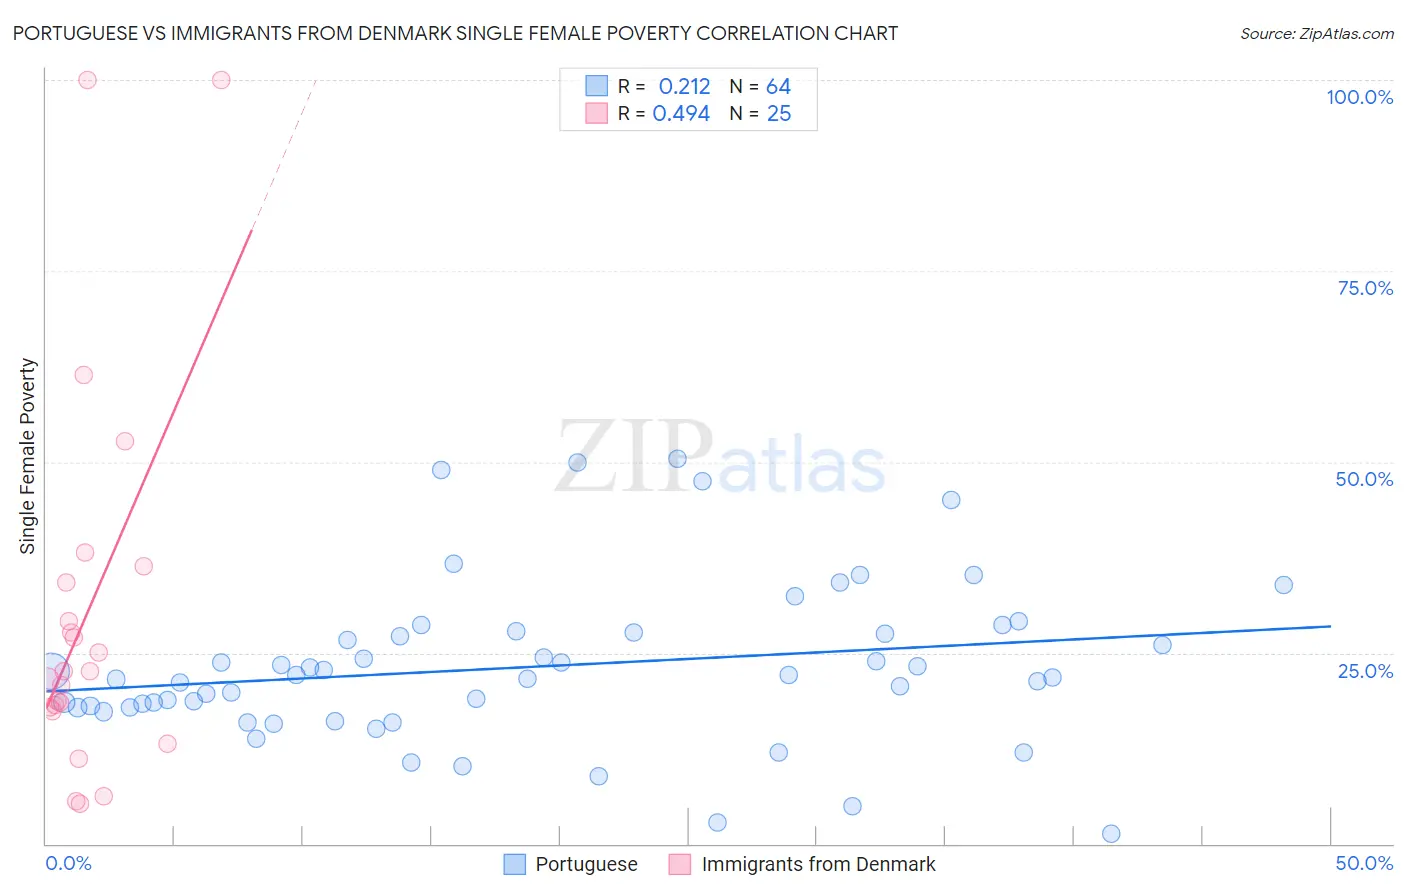
Portuguese vs Immigrants from Denmark Single Female Poverty Correlation Chart
The statistical analysis conducted on geographies consisting of 440,230,754 people shows a weak positive correlation between the proportion of Portuguese and poverty level among single females in the United States with a correlation coefficient (R) of 0.212 and weighted average of 20.5%. Similarly, the statistical analysis conducted on geographies consisting of 135,190,305 people shows a moderate positive correlation between the proportion of Immigrants from Denmark and poverty level among single females in the United States with a correlation coefficient (R) of 0.494 and weighted average of 20.5%, a difference of 0.10%.
Single Female Poverty Correlation Summary
| Measurement | Portuguese | Immigrants from Denmark |
| Minimum | 1.2% | 5.3% |
| Maximum | 50.5% | 100.0% |
| Range | 49.2% | 94.7% |
| Mean | 23.2% | 30.0% |
| Median | 22.0% | 22.5% |
| Interquartile 25% (IQ1) | 17.8% | 17.7% |
| Interquartile 75% (IQ3) | 27.5% | 35.3% |
| Interquartile Range (IQR) | 9.7% | 17.6% |
| Standard Deviation (Sample) | 10.4% | 24.9% |
| Standard Deviation (Population) | 10.3% | 24.4% |
Demographics Similar to Portuguese and Immigrants from Denmark by Single Female Poverty
In terms of single female poverty, the demographic groups most similar to Portuguese are Puget Sound Salish (20.6%, a difference of 0.19%), Immigrants from Uruguay (20.6%, a difference of 0.38%), Luxembourger (20.4%, a difference of 0.39%), Swedish (20.6%, a difference of 0.43%), and South African (20.4%, a difference of 0.44%). Similarly, the demographic groups most similar to Immigrants from Denmark are Puget Sound Salish (20.6%, a difference of 0.090%), Immigrants from Uruguay (20.6%, a difference of 0.28%), Swedish (20.6%, a difference of 0.33%), Immigrants from Western Europe (20.6%, a difference of 0.36%), and Samoan (20.6%, a difference of 0.42%).
| Demographics | Rating | Rank | Single Female Poverty |
| Immigrants | Kuwait | 90.4 /100 | #139 | Exceptional 20.3% |
| Syrians | 90.4 /100 | #140 | Exceptional 20.3% |
| Immigrants | North America | 89.5 /100 | #141 | Excellent 20.3% |
| Immigrants | Uganda | 89.1 /100 | #142 | Excellent 20.3% |
| Australians | 88.4 /100 | #143 | Excellent 20.3% |
| Immigrants | Uzbekistan | 88.3 /100 | #144 | Excellent 20.3% |
| Austrians | 85.8 /100 | #145 | Excellent 20.4% |
| Venezuelans | 85.5 /100 | #146 | Excellent 20.4% |
| South Africans | 85.3 /100 | #147 | Excellent 20.4% |
| Luxembourgers | 84.9 /100 | #148 | Excellent 20.4% |
| Portuguese | 81.5 /100 | #149 | Excellent 20.5% |
| Immigrants | Denmark | 80.5 /100 | #150 | Excellent 20.5% |
| Puget Sound Salish | 79.6 /100 | #151 | Good 20.6% |
| Immigrants | Uruguay | 77.7 /100 | #152 | Good 20.6% |
| Swedes | 77.1 /100 | #153 | Good 20.6% |
| Immigrants | Western Europe | 76.7 /100 | #154 | Good 20.6% |
| Samoans | 76.0 /100 | #155 | Good 20.6% |
| South American Indians | 75.7 /100 | #156 | Good 20.6% |
| Immigrants | Oceania | 74.3 /100 | #157 | Good 20.7% |
| Danes | 73.0 /100 | #158 | Good 20.7% |
| Costa Ricans | 71.8 /100 | #159 | Good 20.7% |