Paraguayan vs Immigrants from Zimbabwe Single Mother Poverty
COMPARE
Paraguayan
Immigrants from Zimbabwe
Single Mother Poverty
Single Mother Poverty Comparison
Paraguayans
Immigrants from Zimbabwe
27.2%
SINGLE MOTHER POVERTY
99.6/ 100
METRIC RATING
59th/ 347
METRIC RANK
28.1%
SINGLE MOTHER POVERTY
95.5/ 100
METRIC RATING
108th/ 347
METRIC RANK
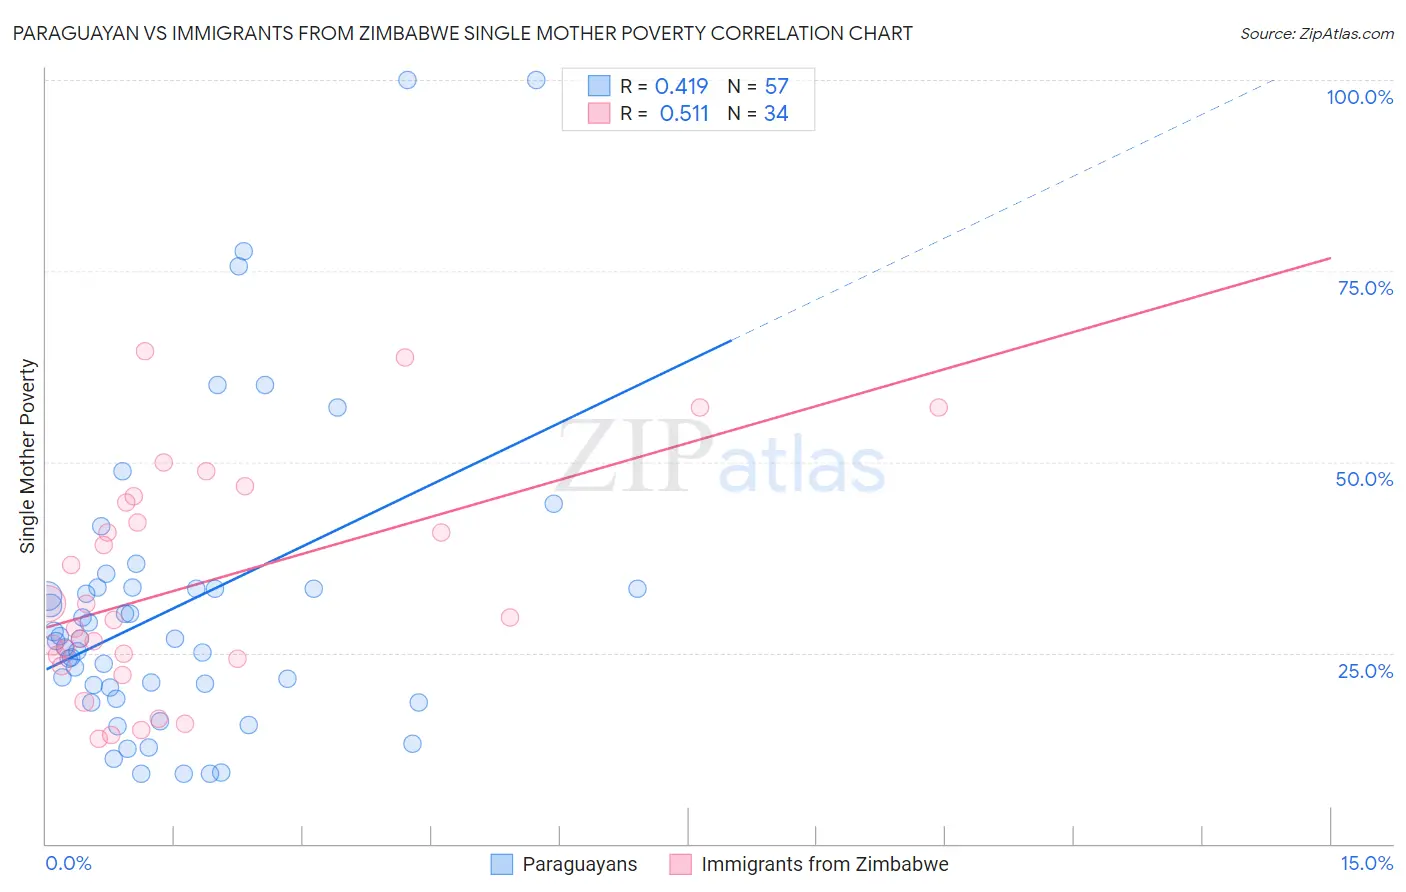
Paraguayan vs Immigrants from Zimbabwe Single Mother Poverty Correlation Chart
The statistical analysis conducted on geographies consisting of 94,301,501 people shows a moderate positive correlation between the proportion of Paraguayans and poverty level among single mothers in the United States with a correlation coefficient (R) of 0.419 and weighted average of 27.2%. Similarly, the statistical analysis conducted on geographies consisting of 116,684,460 people shows a substantial positive correlation between the proportion of Immigrants from Zimbabwe and poverty level among single mothers in the United States with a correlation coefficient (R) of 0.511 and weighted average of 28.1%, a difference of 3.3%.
Single Mother Poverty Correlation Summary
| Measurement | Paraguayan | Immigrants from Zimbabwe |
| Minimum | 9.1% | 13.8% |
| Maximum | 100.0% | 64.4% |
| Range | 90.9% | 50.6% |
| Mean | 31.1% | 33.7% |
| Median | 26.8% | 29.5% |
| Interquartile 25% (IQ1) | 19.7% | 24.3% |
| Interquartile 75% (IQ3) | 33.4% | 44.7% |
| Interquartile Range (IQR) | 13.7% | 20.4% |
| Standard Deviation (Sample) | 19.9% | 14.4% |
| Standard Deviation (Population) | 19.7% | 14.2% |
Similar Demographics by Single Mother Poverty
Demographics Similar to Paraguayans by Single Mother Poverty
In terms of single mother poverty, the demographic groups most similar to Paraguayans are Argentinean (27.2%, a difference of 0.010%), Eastern European (27.2%, a difference of 0.040%), Immigrants from Eastern Europe (27.2%, a difference of 0.15%), Palestinian (27.2%, a difference of 0.17%), and Immigrants from Romania (27.2%, a difference of 0.20%).
| Demographics | Rating | Rank | Single Mother Poverty |
| Immigrants | South Eastern Asia | 99.7 /100 | #52 | Exceptional 27.1% |
| Immigrants | Jordan | 99.7 /100 | #53 | Exceptional 27.1% |
| Immigrants | Bulgaria | 99.7 /100 | #54 | Exceptional 27.1% |
| Immigrants | Egypt | 99.7 /100 | #55 | Exceptional 27.1% |
| Immigrants | Romania | 99.7 /100 | #56 | Exceptional 27.2% |
| Palestinians | 99.7 /100 | #57 | Exceptional 27.2% |
| Argentineans | 99.6 /100 | #58 | Exceptional 27.2% |
| Paraguayans | 99.6 /100 | #59 | Exceptional 27.2% |
| Eastern Europeans | 99.6 /100 | #60 | Exceptional 27.2% |
| Immigrants | Eastern Europe | 99.6 /100 | #61 | Exceptional 27.2% |
| Immigrants | Malaysia | 99.5 /100 | #62 | Exceptional 27.3% |
| Immigrants | Northern Europe | 99.5 /100 | #63 | Exceptional 27.3% |
| Russians | 99.5 /100 | #64 | Exceptional 27.3% |
| Immigrants | Turkey | 99.5 /100 | #65 | Exceptional 27.3% |
| Soviet Union | 99.5 /100 | #66 | Exceptional 27.3% |
Demographics Similar to Immigrants from Zimbabwe by Single Mother Poverty
In terms of single mother poverty, the demographic groups most similar to Immigrants from Zimbabwe are Immigrants from Venezuela (28.1%, a difference of 0.080%), Immigrants from Armenia (28.1%, a difference of 0.090%), Croatian (28.2%, a difference of 0.21%), Venezuelan (28.2%, a difference of 0.26%), and Immigrants from Kazakhstan (28.2%, a difference of 0.28%).
| Demographics | Rating | Rank | Single Mother Poverty |
| Pakistanis | 96.9 /100 | #101 | Exceptional 28.0% |
| Immigrants | Croatia | 96.7 /100 | #102 | Exceptional 28.0% |
| Immigrants | Northern Africa | 96.6 /100 | #103 | Exceptional 28.0% |
| Italians | 96.6 /100 | #104 | Exceptional 28.0% |
| Israelis | 96.5 /100 | #105 | Exceptional 28.0% |
| Ukrainians | 96.4 /100 | #106 | Exceptional 28.0% |
| Immigrants | Venezuela | 95.8 /100 | #107 | Exceptional 28.1% |
| Immigrants | Zimbabwe | 95.5 /100 | #108 | Exceptional 28.1% |
| Immigrants | Armenia | 95.2 /100 | #109 | Exceptional 28.1% |
| Croatians | 94.8 /100 | #110 | Exceptional 28.2% |
| Venezuelans | 94.5 /100 | #111 | Exceptional 28.2% |
| Immigrants | Kazakhstan | 94.5 /100 | #112 | Exceptional 28.2% |
| Immigrants | South Africa | 93.2 /100 | #113 | Exceptional 28.3% |
| Immigrants | Western Asia | 92.7 /100 | #114 | Exceptional 28.3% |
| Immigrants | Kuwait | 92.7 /100 | #115 | Exceptional 28.3% |