Barbadian vs Immigrants from Zimbabwe Single Mother Households
COMPARE
Barbadian
Immigrants from Zimbabwe
Single Mother Households
Single Mother Households Comparison
Barbadians
Immigrants from Zimbabwe
7.9%
SINGLE MOTHER HOUSEHOLDS
0.0/ 100
METRIC RATING
295th/ 347
METRIC RANK
6.2%
SINGLE MOTHER HOUSEHOLDS
69.9/ 100
METRIC RATING
162nd/ 347
METRIC RANK
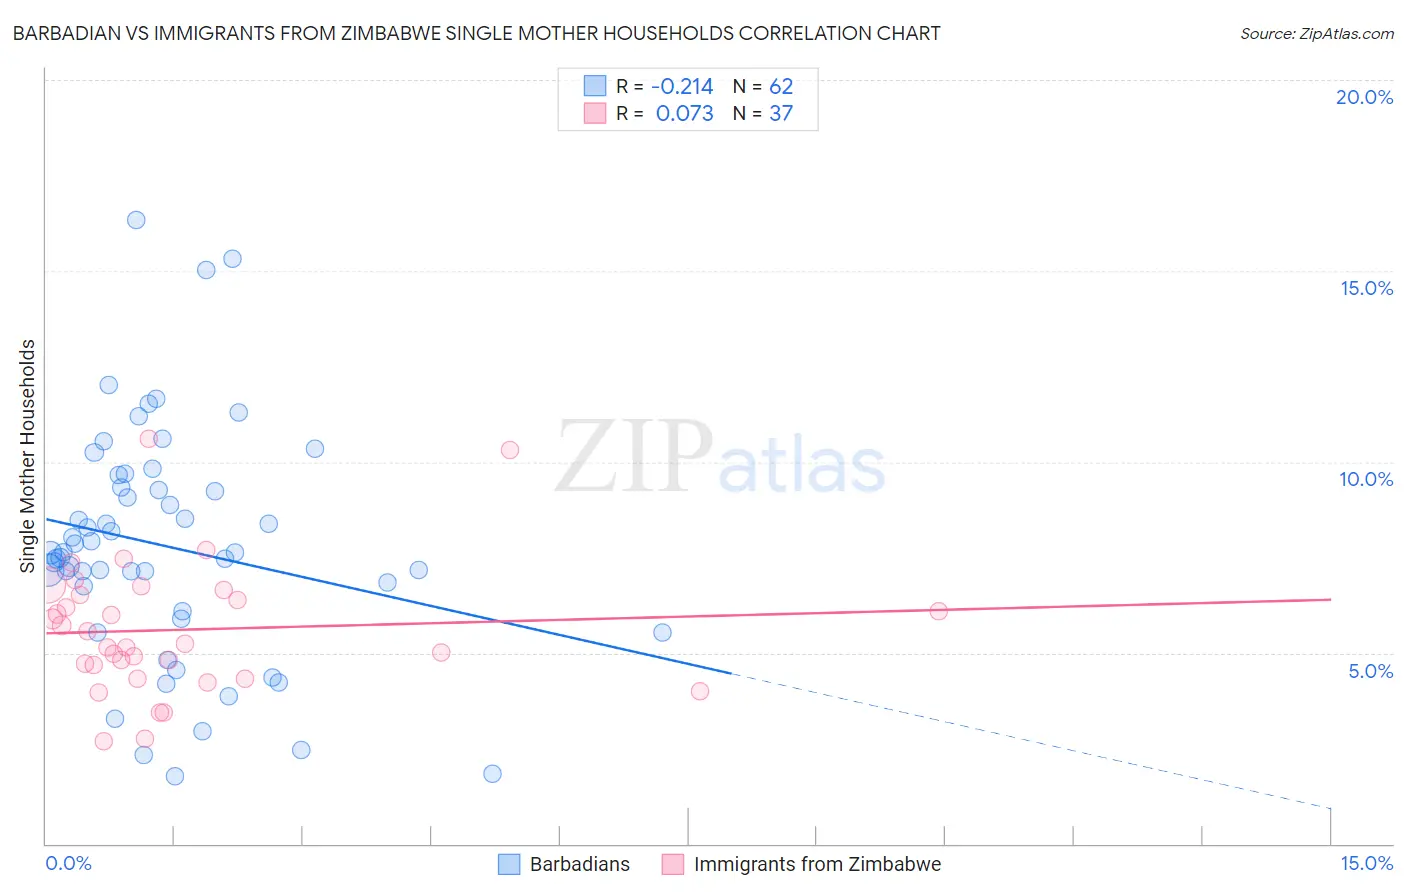
Barbadian vs Immigrants from Zimbabwe Single Mother Households Correlation Chart
The statistical analysis conducted on geographies consisting of 141,217,581 people shows a weak negative correlation between the proportion of Barbadians and percentage of single mother households in the United States with a correlation coefficient (R) of -0.214 and weighted average of 7.9%. Similarly, the statistical analysis conducted on geographies consisting of 117,740,181 people shows a slight positive correlation between the proportion of Immigrants from Zimbabwe and percentage of single mother households in the United States with a correlation coefficient (R) of 0.073 and weighted average of 6.2%, a difference of 28.2%.
Single Mother Households Correlation Summary
| Measurement | Barbadian | Immigrants from Zimbabwe |
| Minimum | 1.8% | 2.7% |
| Maximum | 16.3% | 10.6% |
| Range | 14.6% | 7.9% |
| Mean | 7.8% | 5.6% |
| Median | 7.6% | 5.2% |
| Interquartile 25% (IQ1) | 6.1% | 4.5% |
| Interquartile 75% (IQ3) | 9.3% | 6.6% |
| Interquartile Range (IQR) | 3.2% | 2.1% |
| Standard Deviation (Sample) | 3.1% | 1.7% |
| Standard Deviation (Population) | 3.0% | 1.7% |
Similar Demographics by Single Mother Households
Demographics Similar to Barbadians by Single Mother Households
In terms of single mother households, the demographic groups most similar to Barbadians are Immigrants from Latin America (7.9%, a difference of 0.060%), Hispanic or Latino (7.9%, a difference of 0.10%), Immigrants from West Indies (7.9%, a difference of 0.22%), Apache (7.9%, a difference of 0.29%), and Houma (7.9%, a difference of 0.30%).
| Demographics | Rating | Rank | Single Mother Households |
| Sierra Leoneans | 0.0 /100 | #288 | Tragic 7.7% |
| Sub-Saharan Africans | 0.0 /100 | #289 | Tragic 7.8% |
| Immigrants | Nigeria | 0.0 /100 | #290 | Tragic 7.8% |
| West Indians | 0.0 /100 | #291 | Tragic 7.8% |
| Ghanaians | 0.0 /100 | #292 | Tragic 7.8% |
| Immigrants | Cameroon | 0.0 /100 | #293 | Tragic 7.9% |
| Apache | 0.0 /100 | #294 | Tragic 7.9% |
| Barbadians | 0.0 /100 | #295 | Tragic 7.9% |
| Immigrants | Latin America | 0.0 /100 | #296 | Tragic 7.9% |
| Hispanics or Latinos | 0.0 /100 | #297 | Tragic 7.9% |
| Immigrants | West Indies | 0.0 /100 | #298 | Tragic 7.9% |
| Houma | 0.0 /100 | #299 | Tragic 7.9% |
| Mexicans | 0.0 /100 | #300 | Tragic 8.0% |
| Chippewa | 0.0 /100 | #301 | Tragic 8.0% |
| Immigrants | Ghana | 0.0 /100 | #302 | Tragic 8.0% |
Demographics Similar to Immigrants from Zimbabwe by Single Mother Households
In terms of single mother households, the demographic groups most similar to Immigrants from Zimbabwe are Alsatian (6.2%, a difference of 0.16%), Immigrants from Northern Africa (6.2%, a difference of 0.25%), Immigrants from Syria (6.2%, a difference of 0.32%), Immigrants from Germany (6.1%, a difference of 0.34%), and Iraqi (6.1%, a difference of 0.42%).
| Demographics | Rating | Rank | Single Mother Households |
| Whites/Caucasians | 76.5 /100 | #155 | Good 6.1% |
| Native Hawaiians | 75.0 /100 | #156 | Good 6.1% |
| Chileans | 74.2 /100 | #157 | Good 6.1% |
| Celtics | 73.3 /100 | #158 | Good 6.1% |
| Yugoslavians | 73.1 /100 | #159 | Good 6.1% |
| Iraqis | 73.0 /100 | #160 | Good 6.1% |
| Immigrants | Germany | 72.4 /100 | #161 | Good 6.1% |
| Immigrants | Zimbabwe | 69.9 /100 | #162 | Good 6.2% |
| Alsatians | 68.7 /100 | #163 | Good 6.2% |
| Immigrants | Northern Africa | 68.0 /100 | #164 | Good 6.2% |
| Immigrants | Syria | 67.4 /100 | #165 | Good 6.2% |
| Sri Lankans | 63.9 /100 | #166 | Good 6.2% |
| Brazilians | 59.1 /100 | #167 | Average 6.2% |
| Immigrants | Chile | 58.3 /100 | #168 | Average 6.3% |
| Puget Sound Salish | 58.1 /100 | #169 | Average 6.3% |