Shoshone vs Immigrants from Zimbabwe Single Mother Poverty
COMPARE
Shoshone
Immigrants from Zimbabwe
Single Mother Poverty
Single Mother Poverty Comparison
Shoshone
Immigrants from Zimbabwe
32.9%
SINGLE MOTHER POVERTY
0.0/ 100
METRIC RATING
292nd/ 347
METRIC RANK
28.1%
SINGLE MOTHER POVERTY
95.5/ 100
METRIC RATING
108th/ 347
METRIC RANK
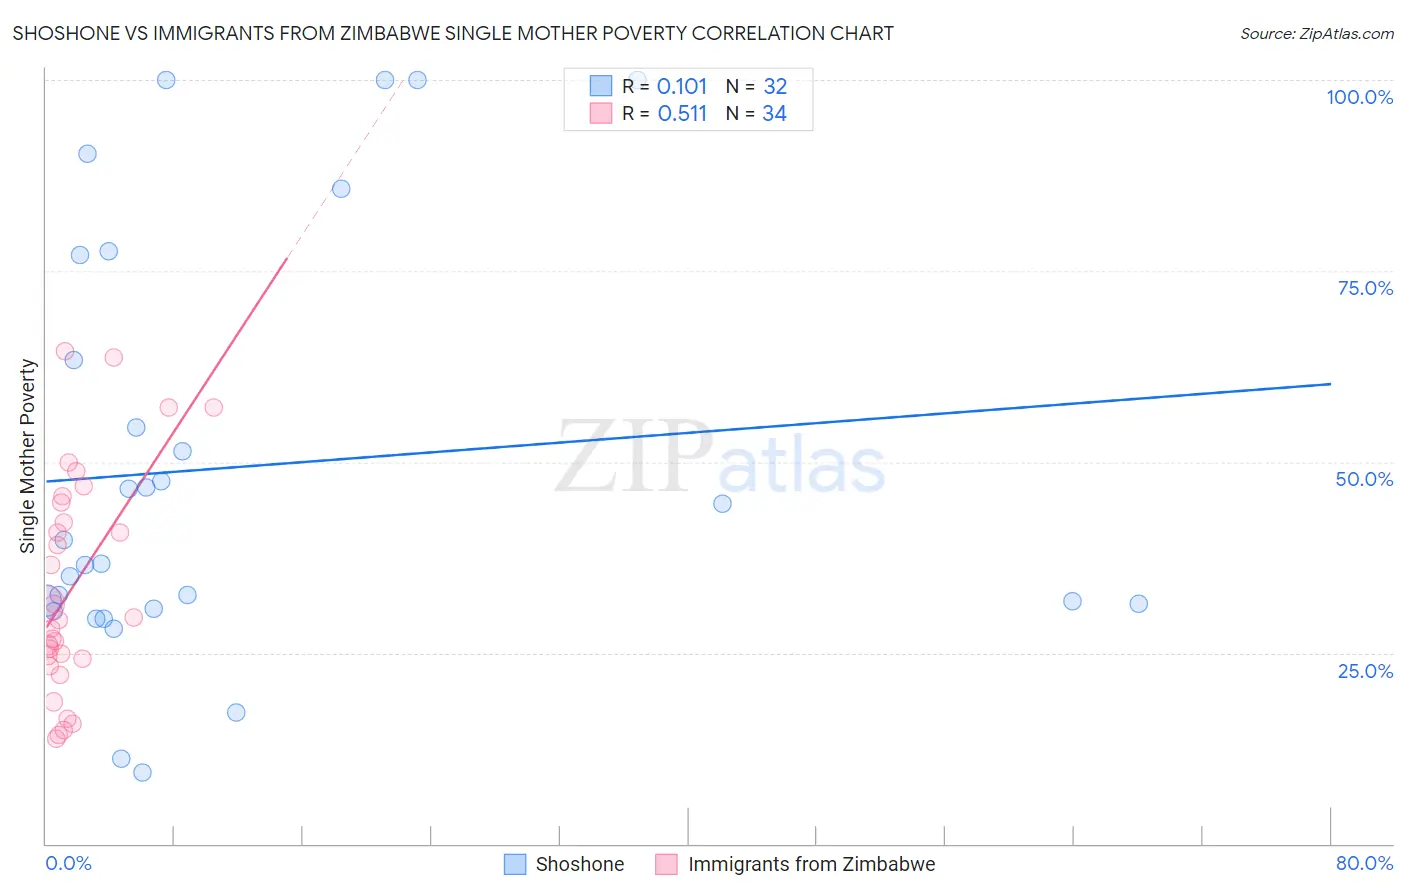
Shoshone vs Immigrants from Zimbabwe Single Mother Poverty Correlation Chart
The statistical analysis conducted on geographies consisting of 66,288,381 people shows a poor positive correlation between the proportion of Shoshone and poverty level among single mothers in the United States with a correlation coefficient (R) of 0.101 and weighted average of 32.9%. Similarly, the statistical analysis conducted on geographies consisting of 116,684,460 people shows a substantial positive correlation between the proportion of Immigrants from Zimbabwe and poverty level among single mothers in the United States with a correlation coefficient (R) of 0.511 and weighted average of 28.1%, a difference of 17.1%.
Single Mother Poverty Correlation Summary
| Measurement | Shoshone | Immigrants from Zimbabwe |
| Minimum | 9.3% | 13.8% |
| Maximum | 100.0% | 64.4% |
| Range | 90.7% | 50.6% |
| Mean | 49.3% | 33.7% |
| Median | 38.2% | 29.5% |
| Interquartile 25% (IQ1) | 31.1% | 24.3% |
| Interquartile 75% (IQ3) | 70.2% | 44.7% |
| Interquartile Range (IQR) | 39.1% | 20.4% |
| Standard Deviation (Sample) | 27.4% | 14.4% |
| Standard Deviation (Population) | 27.0% | 14.2% |
Similar Demographics by Single Mother Poverty
Demographics Similar to Shoshone by Single Mother Poverty
In terms of single mother poverty, the demographic groups most similar to Shoshone are Guatemalan (32.9%, a difference of 0.020%), Aleut (32.9%, a difference of 0.030%), French American Indian (33.1%, a difference of 0.66%), Yaqui (33.1%, a difference of 0.69%), and Blackfeet (33.2%, a difference of 0.85%).
| Demographics | Rating | Rank | Single Mother Poverty |
| Immigrants | Latin America | 0.0 /100 | #285 | Tragic 32.4% |
| Yup'ik | 0.0 /100 | #286 | Tragic 32.5% |
| Immigrants | Dominica | 0.0 /100 | #287 | Tragic 32.5% |
| Somalis | 0.0 /100 | #288 | Tragic 32.6% |
| U.S. Virgin Islanders | 0.0 /100 | #289 | Tragic 32.6% |
| Osage | 0.0 /100 | #290 | Tragic 32.6% |
| Guatemalans | 0.0 /100 | #291 | Tragic 32.9% |
| Shoshone | 0.0 /100 | #292 | Tragic 32.9% |
| Aleuts | 0.0 /100 | #293 | Tragic 32.9% |
| French American Indians | 0.0 /100 | #294 | Tragic 33.1% |
| Yaqui | 0.0 /100 | #295 | Tragic 33.1% |
| Blackfeet | 0.0 /100 | #296 | Tragic 33.2% |
| Pennsylvania Germans | 0.0 /100 | #297 | Tragic 33.2% |
| Africans | 0.0 /100 | #298 | Tragic 33.3% |
| Immigrants | Guatemala | 0.0 /100 | #299 | Tragic 33.3% |
Demographics Similar to Immigrants from Zimbabwe by Single Mother Poverty
In terms of single mother poverty, the demographic groups most similar to Immigrants from Zimbabwe are Immigrants from Venezuela (28.1%, a difference of 0.080%), Immigrants from Armenia (28.1%, a difference of 0.090%), Croatian (28.2%, a difference of 0.21%), Venezuelan (28.2%, a difference of 0.26%), and Immigrants from Kazakhstan (28.2%, a difference of 0.28%).
| Demographics | Rating | Rank | Single Mother Poverty |
| Pakistanis | 96.9 /100 | #101 | Exceptional 28.0% |
| Immigrants | Croatia | 96.7 /100 | #102 | Exceptional 28.0% |
| Immigrants | Northern Africa | 96.6 /100 | #103 | Exceptional 28.0% |
| Italians | 96.6 /100 | #104 | Exceptional 28.0% |
| Israelis | 96.5 /100 | #105 | Exceptional 28.0% |
| Ukrainians | 96.4 /100 | #106 | Exceptional 28.0% |
| Immigrants | Venezuela | 95.8 /100 | #107 | Exceptional 28.1% |
| Immigrants | Zimbabwe | 95.5 /100 | #108 | Exceptional 28.1% |
| Immigrants | Armenia | 95.2 /100 | #109 | Exceptional 28.1% |
| Croatians | 94.8 /100 | #110 | Exceptional 28.2% |
| Venezuelans | 94.5 /100 | #111 | Exceptional 28.2% |
| Immigrants | Kazakhstan | 94.5 /100 | #112 | Exceptional 28.2% |
| Immigrants | South Africa | 93.2 /100 | #113 | Exceptional 28.3% |
| Immigrants | Western Asia | 92.7 /100 | #114 | Exceptional 28.3% |
| Immigrants | Kuwait | 92.7 /100 | #115 | Exceptional 28.3% |