Ugandan vs Immigrants from Zimbabwe Single Mother Poverty
COMPARE
Ugandan
Immigrants from Zimbabwe
Single Mother Poverty
Single Mother Poverty Comparison
Ugandans
Immigrants from Zimbabwe
28.8%
SINGLE MOTHER POVERTY
71.7/ 100
METRIC RATING
155th/ 347
METRIC RANK
28.1%
SINGLE MOTHER POVERTY
95.5/ 100
METRIC RATING
108th/ 347
METRIC RANK
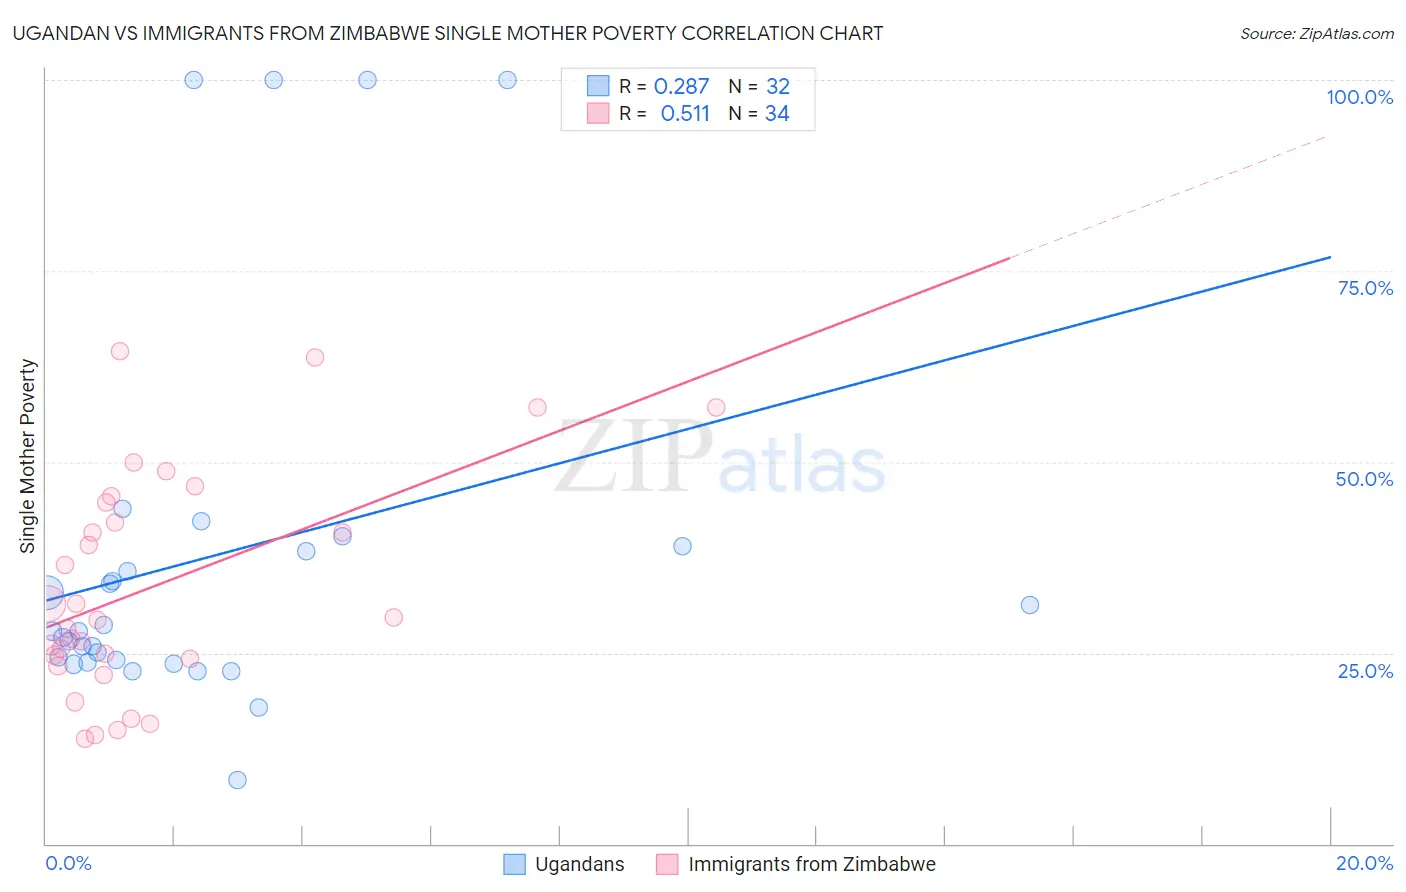
Ugandan vs Immigrants from Zimbabwe Single Mother Poverty Correlation Chart
The statistical analysis conducted on geographies consisting of 93,563,959 people shows a weak positive correlation between the proportion of Ugandans and poverty level among single mothers in the United States with a correlation coefficient (R) of 0.287 and weighted average of 28.8%. Similarly, the statistical analysis conducted on geographies consisting of 116,684,460 people shows a substantial positive correlation between the proportion of Immigrants from Zimbabwe and poverty level among single mothers in the United States with a correlation coefficient (R) of 0.511 and weighted average of 28.1%, a difference of 2.6%.
Single Mother Poverty Correlation Summary
| Measurement | Ugandan | Immigrants from Zimbabwe |
| Minimum | 8.4% | 13.8% |
| Maximum | 100.0% | 64.4% |
| Range | 91.6% | 50.6% |
| Mean | 37.5% | 33.7% |
| Median | 27.8% | 29.5% |
| Interquartile 25% (IQ1) | 23.9% | 24.3% |
| Interquartile 75% (IQ3) | 38.6% | 44.7% |
| Interquartile Range (IQR) | 14.7% | 20.4% |
| Standard Deviation (Sample) | 25.1% | 14.4% |
| Standard Deviation (Population) | 24.7% | 14.2% |
Similar Demographics by Single Mother Poverty
Demographics Similar to Ugandans by Single Mother Poverty
In terms of single mother poverty, the demographic groups most similar to Ugandans are Iraqi (28.8%, a difference of 0.010%), Immigrants from Western Europe (28.9%, a difference of 0.040%), Immigrants from Hungary (28.9%, a difference of 0.070%), Portuguese (28.8%, a difference of 0.090%), and Czech (28.9%, a difference of 0.19%).
| Demographics | Rating | Rank | Single Mother Poverty |
| Syrians | 85.3 /100 | #148 | Excellent 28.6% |
| Serbians | 85.0 /100 | #149 | Excellent 28.6% |
| Northern Europeans | 81.7 /100 | #150 | Excellent 28.6% |
| Immigrants | Oceania | 79.9 /100 | #151 | Good 28.7% |
| Austrians | 79.0 /100 | #152 | Good 28.7% |
| Slovenes | 76.4 /100 | #153 | Good 28.8% |
| Portuguese | 73.2 /100 | #154 | Good 28.8% |
| Ugandans | 71.7 /100 | #155 | Good 28.8% |
| Iraqis | 71.5 /100 | #156 | Good 28.8% |
| Immigrants | Western Europe | 71.1 /100 | #157 | Good 28.9% |
| Immigrants | Hungary | 70.6 /100 | #158 | Good 28.9% |
| Czechs | 68.4 /100 | #159 | Good 28.9% |
| Japanese | 68.0 /100 | #160 | Good 28.9% |
| Immigrants | Cambodia | 66.6 /100 | #161 | Good 28.9% |
| Scandinavians | 66.2 /100 | #162 | Good 28.9% |
Demographics Similar to Immigrants from Zimbabwe by Single Mother Poverty
In terms of single mother poverty, the demographic groups most similar to Immigrants from Zimbabwe are Immigrants from Venezuela (28.1%, a difference of 0.080%), Immigrants from Armenia (28.1%, a difference of 0.090%), Croatian (28.2%, a difference of 0.21%), Venezuelan (28.2%, a difference of 0.26%), and Immigrants from Kazakhstan (28.2%, a difference of 0.28%).
| Demographics | Rating | Rank | Single Mother Poverty |
| Pakistanis | 96.9 /100 | #101 | Exceptional 28.0% |
| Immigrants | Croatia | 96.7 /100 | #102 | Exceptional 28.0% |
| Immigrants | Northern Africa | 96.6 /100 | #103 | Exceptional 28.0% |
| Italians | 96.6 /100 | #104 | Exceptional 28.0% |
| Israelis | 96.5 /100 | #105 | Exceptional 28.0% |
| Ukrainians | 96.4 /100 | #106 | Exceptional 28.0% |
| Immigrants | Venezuela | 95.8 /100 | #107 | Exceptional 28.1% |
| Immigrants | Zimbabwe | 95.5 /100 | #108 | Exceptional 28.1% |
| Immigrants | Armenia | 95.2 /100 | #109 | Exceptional 28.1% |
| Croatians | 94.8 /100 | #110 | Exceptional 28.2% |
| Venezuelans | 94.5 /100 | #111 | Exceptional 28.2% |
| Immigrants | Kazakhstan | 94.5 /100 | #112 | Exceptional 28.2% |
| Immigrants | South Africa | 93.2 /100 | #113 | Exceptional 28.3% |
| Immigrants | Western Asia | 92.7 /100 | #114 | Exceptional 28.3% |
| Immigrants | Kuwait | 92.7 /100 | #115 | Exceptional 28.3% |