Bahamian vs Jordanian Female Poverty
COMPARE
Bahamian
Jordanian
Female Poverty
Female Poverty Comparison
Bahamians
Jordanians
16.6%
FEMALE POVERTY
0.0/ 100
METRIC RATING
300th/ 347
METRIC RANK
12.3%
FEMALE POVERTY
97.1/ 100
METRIC RATING
82nd/ 347
METRIC RANK
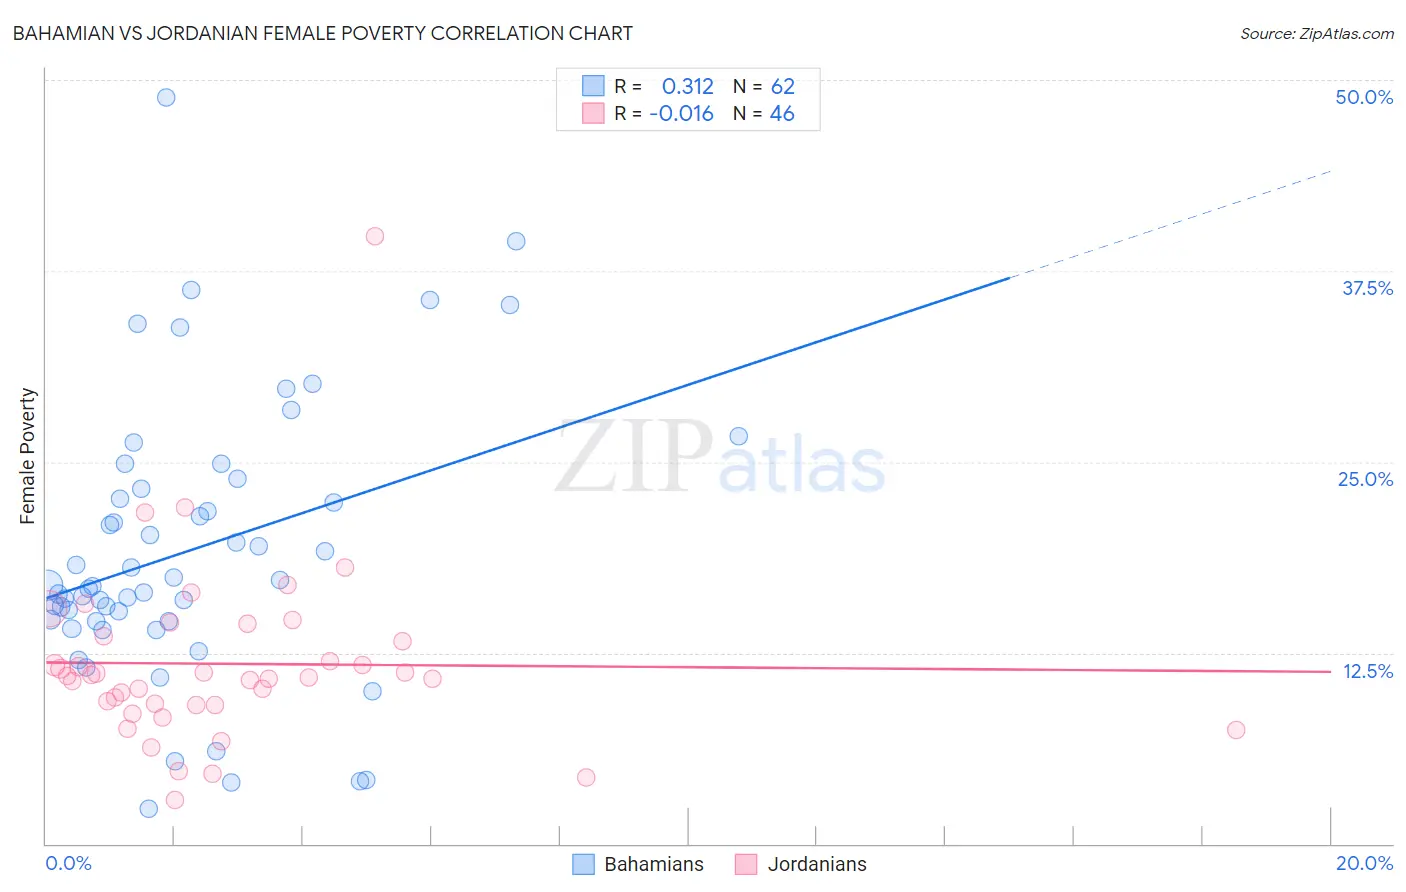
Bahamian vs Jordanian Female Poverty Correlation Chart
The statistical analysis conducted on geographies consisting of 112,629,599 people shows a mild positive correlation between the proportion of Bahamians and poverty level among females in the United States with a correlation coefficient (R) of 0.312 and weighted average of 16.6%. Similarly, the statistical analysis conducted on geographies consisting of 166,392,189 people shows no correlation between the proportion of Jordanians and poverty level among females in the United States with a correlation coefficient (R) of -0.016 and weighted average of 12.3%, a difference of 35.2%.
Female Poverty Correlation Summary
| Measurement | Bahamian | Jordanian |
| Minimum | 2.3% | 2.9% |
| Maximum | 48.8% | 39.7% |
| Range | 46.5% | 36.8% |
| Mean | 19.2% | 11.8% |
| Median | 16.9% | 10.9% |
| Interquartile 25% (IQ1) | 14.6% | 9.1% |
| Interquartile 75% (IQ3) | 23.2% | 13.6% |
| Interquartile Range (IQR) | 8.7% | 4.5% |
| Standard Deviation (Sample) | 9.1% | 5.8% |
| Standard Deviation (Population) | 9.0% | 5.8% |
Similar Demographics by Female Poverty
Demographics Similar to Bahamians by Female Poverty
In terms of female poverty, the demographic groups most similar to Bahamians are Hispanic or Latino (16.6%, a difference of 0.040%), Guatemalan (16.7%, a difference of 0.33%), Chippewa (16.7%, a difference of 0.36%), Somali (16.6%, a difference of 0.56%), and Mexican (16.5%, a difference of 0.77%).
| Demographics | Rating | Rank | Female Poverty |
| Immigrants | Latin America | 0.0 /100 | #293 | Tragic 16.4% |
| Immigrants | Cabo Verde | 0.0 /100 | #294 | Tragic 16.4% |
| Senegalese | 0.0 /100 | #295 | Tragic 16.5% |
| Immigrants | Senegal | 0.0 /100 | #296 | Tragic 16.5% |
| Mexicans | 0.0 /100 | #297 | Tragic 16.5% |
| Somalis | 0.0 /100 | #298 | Tragic 16.6% |
| Hispanics or Latinos | 0.0 /100 | #299 | Tragic 16.6% |
| Bahamians | 0.0 /100 | #300 | Tragic 16.6% |
| Guatemalans | 0.0 /100 | #301 | Tragic 16.7% |
| Chippewa | 0.0 /100 | #302 | Tragic 16.7% |
| Choctaw | 0.0 /100 | #303 | Tragic 16.8% |
| Immigrants | Central America | 0.0 /100 | #304 | Tragic 16.8% |
| Immigrants | Grenada | 0.0 /100 | #305 | Tragic 16.8% |
| Immigrants | Caribbean | 0.0 /100 | #306 | Tragic 16.9% |
| Seminole | 0.0 /100 | #307 | Tragic 16.9% |
Demographics Similar to Jordanians by Female Poverty
In terms of female poverty, the demographic groups most similar to Jordanians are Slovak (12.3%, a difference of 0.010%), Immigrants from Sweden (12.3%, a difference of 0.010%), Immigrants from North America (12.3%, a difference of 0.060%), Egyptian (12.3%, a difference of 0.13%), and Serbian (12.3%, a difference of 0.14%).
| Demographics | Rating | Rank | Female Poverty |
| Europeans | 97.4 /100 | #75 | Exceptional 12.3% |
| Immigrants | Eastern Europe | 97.2 /100 | #76 | Exceptional 12.3% |
| Serbians | 97.2 /100 | #77 | Exceptional 12.3% |
| Egyptians | 97.2 /100 | #78 | Exceptional 12.3% |
| Immigrants | North America | 97.1 /100 | #79 | Exceptional 12.3% |
| Slovaks | 97.1 /100 | #80 | Exceptional 12.3% |
| Immigrants | Sweden | 97.1 /100 | #81 | Exceptional 12.3% |
| Jordanians | 97.1 /100 | #82 | Exceptional 12.3% |
| Immigrants | England | 96.9 /100 | #83 | Exceptional 12.3% |
| Northern Europeans | 96.6 /100 | #84 | Exceptional 12.4% |
| Irish | 96.5 /100 | #85 | Exceptional 12.4% |
| Dutch | 96.5 /100 | #86 | Exceptional 12.4% |
| Okinawans | 96.4 /100 | #87 | Exceptional 12.4% |
| Finns | 96.4 /100 | #88 | Exceptional 12.4% |
| English | 96.1 /100 | #89 | Exceptional 12.4% |