Bahamian vs Immigrants from China 8th Grade
COMPARE
Bahamian
Immigrants from China
8th Grade
8th Grade Comparison
Bahamians
Immigrants from China
95.3%
8TH GRADE
5.6/ 100
METRIC RATING
227th/ 347
METRIC RANK
95.0%
8TH GRADE
1.1/ 100
METRIC RATING
249th/ 347
METRIC RANK
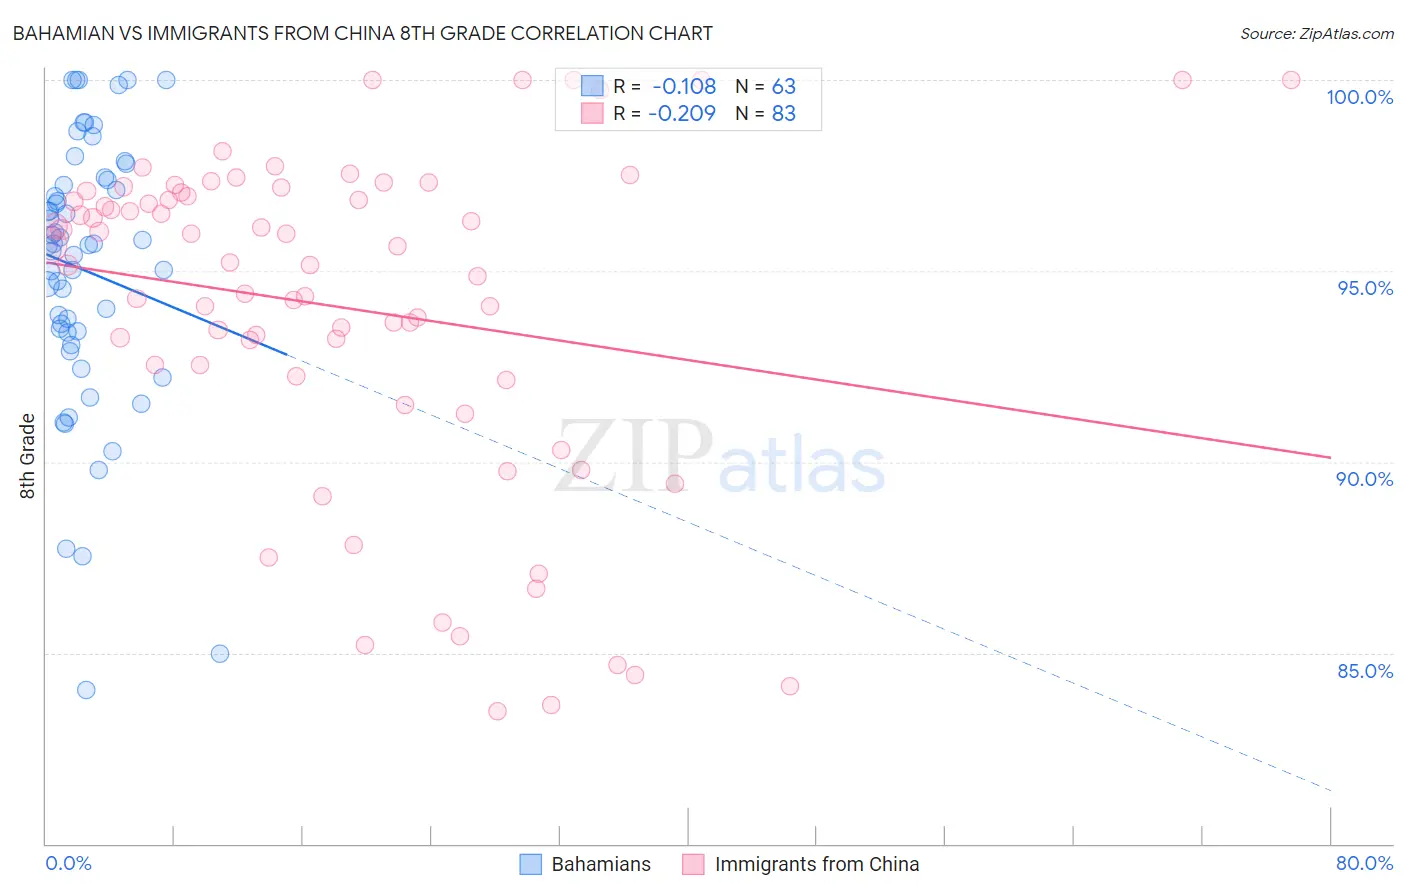
Bahamian vs Immigrants from China 8th Grade Correlation Chart
The statistical analysis conducted on geographies consisting of 112,698,819 people shows a poor negative correlation between the proportion of Bahamians and percentage of population with at least 8th grade education in the United States with a correlation coefficient (R) of -0.108 and weighted average of 95.3%. Similarly, the statistical analysis conducted on geographies consisting of 457,082,957 people shows a weak negative correlation between the proportion of Immigrants from China and percentage of population with at least 8th grade education in the United States with a correlation coefficient (R) of -0.209 and weighted average of 95.0%, a difference of 0.28%.
8th Grade Correlation Summary
| Measurement | Bahamian | Immigrants from China |
| Minimum | 84.0% | 83.5% |
| Maximum | 100.0% | 100.0% |
| Range | 16.0% | 16.5% |
| Mean | 95.0% | 94.0% |
| Median | 95.7% | 95.2% |
| Interquartile 25% (IQ1) | 93.4% | 92.3% |
| Interquartile 75% (IQ3) | 97.4% | 97.0% |
| Interquartile Range (IQR) | 4.0% | 4.8% |
| Standard Deviation (Sample) | 3.5% | 4.4% |
| Standard Deviation (Population) | 3.5% | 4.3% |
Similar Demographics by 8th Grade
Demographics Similar to Bahamians by 8th Grade
In terms of 8th grade, the demographic groups most similar to Bahamians are Navajo (95.3%, a difference of 0.0%), Immigrants from Eastern Africa (95.3%, a difference of 0.0%), Immigrants from Western Asia (95.3%, a difference of 0.010%), Subsaharan African (95.3%, a difference of 0.010%), and Immigrants from Oceania (95.3%, a difference of 0.040%).
| Demographics | Rating | Rank | 8th Grade |
| Immigrants | Southern Europe | 7.7 /100 | #220 | Tragic 95.3% |
| Immigrants | Syria | 7.4 /100 | #221 | Tragic 95.3% |
| Immigrants | Malaysia | 7.3 /100 | #222 | Tragic 95.3% |
| Immigrants | Oceania | 7.1 /100 | #223 | Tragic 95.3% |
| Immigrants | Western Asia | 6.0 /100 | #224 | Tragic 95.3% |
| Sub-Saharan Africans | 6.0 /100 | #225 | Tragic 95.3% |
| Navajo | 5.7 /100 | #226 | Tragic 95.3% |
| Bahamians | 5.6 /100 | #227 | Tragic 95.3% |
| Immigrants | Eastern Africa | 5.6 /100 | #228 | Tragic 95.3% |
| Immigrants | Indonesia | 4.4 /100 | #229 | Tragic 95.3% |
| Immigrants | Panama | 4.1 /100 | #230 | Tragic 95.2% |
| Asians | 3.5 /100 | #231 | Tragic 95.2% |
| Indians (Asian) | 3.3 /100 | #232 | Tragic 95.2% |
| Immigrants | Asia | 3.1 /100 | #233 | Tragic 95.2% |
| Costa Ricans | 3.0 /100 | #234 | Tragic 95.2% |
Demographics Similar to Immigrants from China by 8th Grade
In terms of 8th grade, the demographic groups most similar to Immigrants from China are Korean (95.0%, a difference of 0.0%), Bolivian (95.0%, a difference of 0.010%), Uruguayan (95.1%, a difference of 0.020%), Immigrants from Ethiopia (95.0%, a difference of 0.020%), and U.S. Virgin Islander (95.0%, a difference of 0.030%).
| Demographics | Rating | Rank | 8th Grade |
| Tongans | 1.7 /100 | #242 | Tragic 95.1% |
| Paiute | 1.7 /100 | #243 | Tragic 95.1% |
| Immigrants | Middle Africa | 1.7 /100 | #244 | Tragic 95.1% |
| Jamaicans | 1.4 /100 | #245 | Tragic 95.1% |
| Somalis | 1.4 /100 | #246 | Tragic 95.1% |
| Immigrants | Senegal | 1.4 /100 | #247 | Tragic 95.1% |
| Uruguayans | 1.2 /100 | #248 | Tragic 95.1% |
| Immigrants | China | 1.1 /100 | #249 | Tragic 95.0% |
| Koreans | 1.1 /100 | #250 | Tragic 95.0% |
| Bolivians | 1.0 /100 | #251 | Tragic 95.0% |
| Immigrants | Ethiopia | 1.0 /100 | #252 | Tragic 95.0% |
| U.S. Virgin Islanders | 0.9 /100 | #253 | Tragic 95.0% |
| Immigrants | Cameroon | 0.8 /100 | #254 | Tragic 95.0% |
| Immigrants | Somalia | 0.7 /100 | #255 | Tragic 95.0% |
| Colombians | 0.7 /100 | #256 | Tragic 95.0% |