Australian vs Puget Sound Salish Male Poverty
COMPARE
Australian
Puget Sound Salish
Male Poverty
Male Poverty Comparison
Australians
Puget Sound Salish
10.4%
MALE POVERTY
94.4/ 100
METRIC RATING
93rd/ 347
METRIC RANK
10.7%
MALE POVERTY
84.3/ 100
METRIC RATING
127th/ 347
METRIC RANK
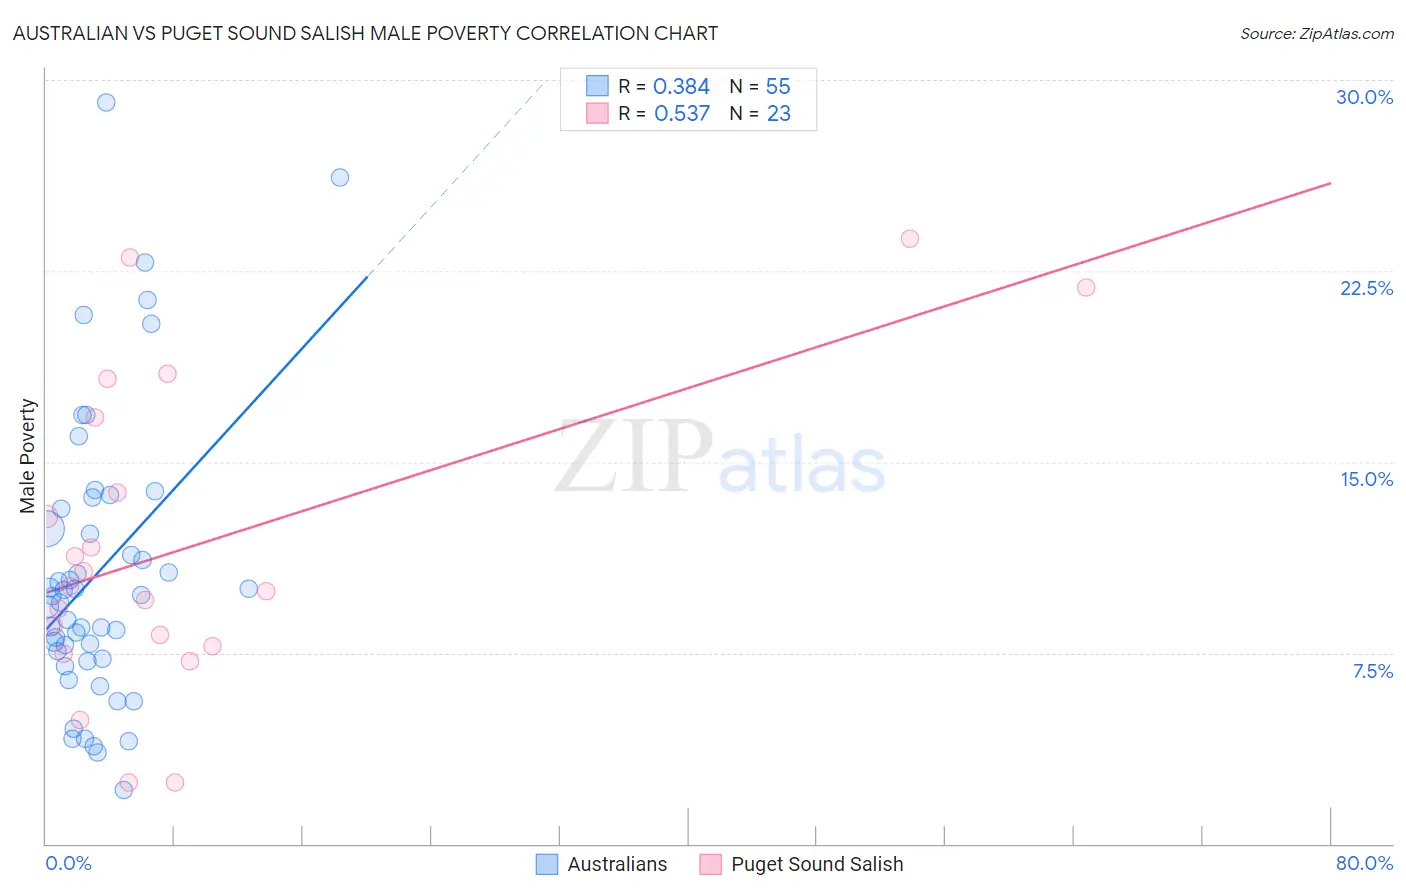
Australian vs Puget Sound Salish Male Poverty Correlation Chart
The statistical analysis conducted on geographies consisting of 223,991,142 people shows a mild positive correlation between the proportion of Australians and poverty level among males in the United States with a correlation coefficient (R) of 0.384 and weighted average of 10.4%. Similarly, the statistical analysis conducted on geographies consisting of 46,147,564 people shows a substantial positive correlation between the proportion of Puget Sound Salish and poverty level among males in the United States with a correlation coefficient (R) of 0.537 and weighted average of 10.7%, a difference of 3.0%.
Male Poverty Correlation Summary
| Measurement | Australian | Puget Sound Salish |
| Minimum | 2.1% | 2.4% |
| Maximum | 29.1% | 23.8% |
| Range | 27.0% | 21.4% |
| Mean | 10.7% | 11.7% |
| Median | 9.7% | 10.1% |
| Interquartile 25% (IQ1) | 7.3% | 7.8% |
| Interquartile 75% (IQ3) | 13.1% | 16.7% |
| Interquartile Range (IQR) | 5.9% | 9.0% |
| Standard Deviation (Sample) | 5.7% | 6.1% |
| Standard Deviation (Population) | 5.6% | 5.9% |
Similar Demographics by Male Poverty
Demographics Similar to Australians by Male Poverty
In terms of male poverty, the demographic groups most similar to Australians are Jordanian (10.4%, a difference of 0.0%), Immigrants from South Africa (10.4%, a difference of 0.17%), British (10.4%, a difference of 0.20%), Scottish (10.4%, a difference of 0.20%), and Indian (Asian) (10.4%, a difference of 0.27%).
| Demographics | Rating | Rank | Male Poverty |
| Immigrants | Eastern Asia | 95.3 /100 | #86 | Exceptional 10.4% |
| Northern Europeans | 95.2 /100 | #87 | Exceptional 10.4% |
| Cambodians | 95.0 /100 | #88 | Exceptional 10.4% |
| Immigrants | Denmark | 95.0 /100 | #89 | Exceptional 10.4% |
| Indians (Asian) | 94.9 /100 | #90 | Exceptional 10.4% |
| British | 94.8 /100 | #91 | Exceptional 10.4% |
| Jordanians | 94.4 /100 | #92 | Exceptional 10.4% |
| Australians | 94.4 /100 | #93 | Exceptional 10.4% |
| Immigrants | South Africa | 94.1 /100 | #94 | Exceptional 10.4% |
| Scottish | 94.0 /100 | #95 | Exceptional 10.4% |
| Immigrants | Egypt | 93.7 /100 | #96 | Exceptional 10.4% |
| Romanians | 93.6 /100 | #97 | Exceptional 10.5% |
| Finns | 93.4 /100 | #98 | Exceptional 10.5% |
| Immigrants | Indonesia | 93.3 /100 | #99 | Exceptional 10.5% |
| Immigrants | Latvia | 92.8 /100 | #100 | Exceptional 10.5% |
Demographics Similar to Puget Sound Salish by Male Poverty
In terms of male poverty, the demographic groups most similar to Puget Sound Salish are Immigrants from Ukraine (10.7%, a difference of 0.0%), Immigrants from Western Europe (10.7%, a difference of 0.020%), Immigrants from Peru (10.7%, a difference of 0.030%), Chilean (10.7%, a difference of 0.070%), and Immigrants from Belarus (10.7%, a difference of 0.18%).
| Demographics | Rating | Rank | Male Poverty |
| Immigrants | China | 87.1 /100 | #120 | Excellent 10.7% |
| Peruvians | 87.1 /100 | #121 | Excellent 10.7% |
| Native Hawaiians | 87.0 /100 | #122 | Excellent 10.7% |
| South Africans | 86.8 /100 | #123 | Excellent 10.7% |
| French | 86.7 /100 | #124 | Excellent 10.7% |
| Immigrants | Norway | 86.0 /100 | #125 | Excellent 10.7% |
| Immigrants | Ukraine | 84.3 /100 | #126 | Excellent 10.7% |
| Puget Sound Salish | 84.3 /100 | #127 | Excellent 10.7% |
| Immigrants | Western Europe | 84.2 /100 | #128 | Excellent 10.7% |
| Immigrants | Peru | 84.1 /100 | #129 | Excellent 10.7% |
| Chileans | 83.9 /100 | #130 | Excellent 10.7% |
| Immigrants | Belarus | 83.3 /100 | #131 | Excellent 10.7% |
| Immigrants | Vietnam | 83.0 /100 | #132 | Excellent 10.8% |
| Pakistanis | 83.0 /100 | #133 | Excellent 10.8% |
| New Zealanders | 82.9 /100 | #134 | Excellent 10.8% |