Moroccan vs Uruguayan Child Poverty Among Girls Under 16
COMPARE
Moroccan
Uruguayan
Child Poverty Among Girls Under 16
Child Poverty Among Girls Under 16 Comparison
Moroccans
Uruguayans
17.8%
CHILD POVERTY AMONG GIRLS UNDER 16
5.5/ 100
METRIC RATING
216th/ 347
METRIC RANK
16.2%
CHILD POVERTY AMONG GIRLS UNDER 16
64.7/ 100
METRIC RATING
167th/ 347
METRIC RANK
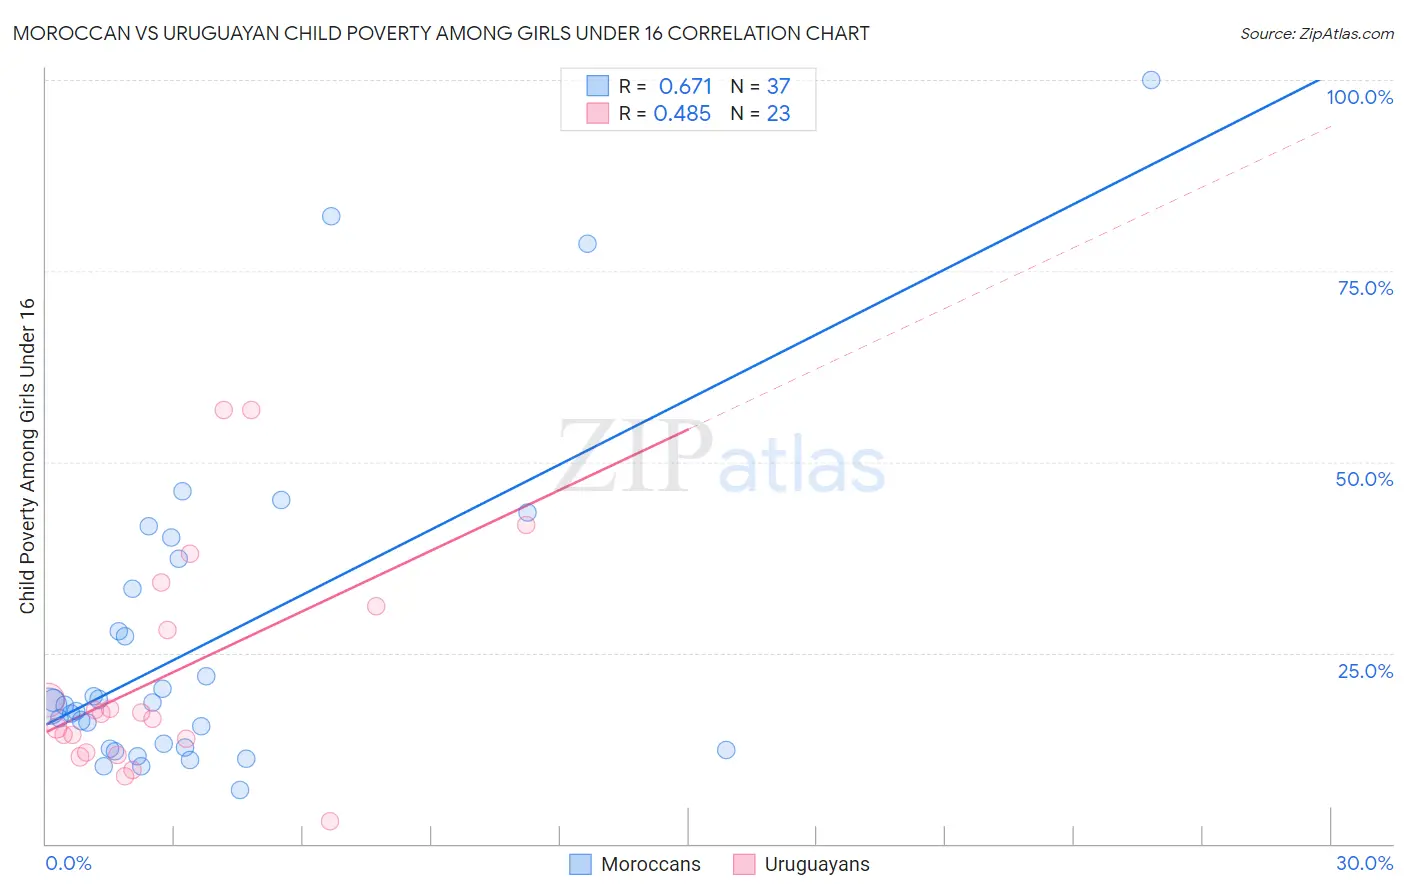
Moroccan vs Uruguayan Child Poverty Among Girls Under 16 Correlation Chart
The statistical analysis conducted on geographies consisting of 200,064,228 people shows a significant positive correlation between the proportion of Moroccans and poverty level among girls under the age of 16 in the United States with a correlation coefficient (R) of 0.671 and weighted average of 17.8%. Similarly, the statistical analysis conducted on geographies consisting of 143,695,709 people shows a moderate positive correlation between the proportion of Uruguayans and poverty level among girls under the age of 16 in the United States with a correlation coefficient (R) of 0.485 and weighted average of 16.2%, a difference of 10.1%.
Child Poverty Among Girls Under 16 Correlation Summary
| Measurement | Moroccan | Uruguayan |
| Minimum | 7.0% | 3.0% |
| Maximum | 100.0% | 56.8% |
| Range | 93.0% | 53.8% |
| Mean | 26.4% | 22.0% |
| Median | 18.1% | 17.1% |
| Interquartile 25% (IQ1) | 12.6% | 11.9% |
| Interquartile 75% (IQ3) | 35.4% | 31.0% |
| Interquartile Range (IQR) | 22.8% | 19.1% |
| Standard Deviation (Sample) | 21.4% | 14.6% |
| Standard Deviation (Population) | 21.1% | 14.3% |
Similar Demographics by Child Poverty Among Girls Under 16
Demographics Similar to Moroccans by Child Poverty Among Girls Under 16
In terms of child poverty among girls under 16, the demographic groups most similar to Moroccans are Japanese (17.8%, a difference of 0.090%), Malaysian (17.8%, a difference of 0.10%), German Russian (17.8%, a difference of 0.10%), Pennsylvania German (17.8%, a difference of 0.12%), and Alaska Native (17.8%, a difference of 0.18%).
| Demographics | Rating | Rank | Child Poverty Among Girls Under 16 |
| Panamanians | 8.7 /100 | #209 | Tragic 17.6% |
| Immigrants | Immigrants | 7.3 /100 | #210 | Tragic 17.7% |
| Immigrants | Eastern Africa | 6.4 /100 | #211 | Tragic 17.7% |
| Immigrants | Thailand | 6.3 /100 | #212 | Tragic 17.7% |
| Pennsylvania Germans | 5.7 /100 | #213 | Tragic 17.8% |
| Malaysians | 5.7 /100 | #214 | Tragic 17.8% |
| German Russians | 5.7 /100 | #215 | Tragic 17.8% |
| Moroccans | 5.5 /100 | #216 | Tragic 17.8% |
| Japanese | 5.3 /100 | #217 | Tragic 17.8% |
| Alaska Natives | 5.2 /100 | #218 | Tragic 17.8% |
| Immigrants | Panama | 4.7 /100 | #219 | Tragic 17.9% |
| Cubans | 4.1 /100 | #220 | Tragic 18.0% |
| Immigrants | Micronesia | 3.5 /100 | #221 | Tragic 18.0% |
| Immigrants | Cambodia | 2.9 /100 | #222 | Tragic 18.1% |
| Immigrants | Armenia | 2.9 /100 | #223 | Tragic 18.1% |
Demographics Similar to Uruguayans by Child Poverty Among Girls Under 16
In terms of child poverty among girls under 16, the demographic groups most similar to Uruguayans are Yugoslavian (16.2%, a difference of 0.040%), Costa Rican (16.2%, a difference of 0.060%), Immigrants from Venezuela (16.2%, a difference of 0.060%), Immigrants from Saudi Arabia (16.2%, a difference of 0.090%), and Afghan (16.2%, a difference of 0.30%).
| Demographics | Rating | Rank | Child Poverty Among Girls Under 16 |
| French | 72.8 /100 | #160 | Good 16.0% |
| Immigrants | Northern Africa | 72.0 /100 | #161 | Good 16.0% |
| French Canadians | 68.7 /100 | #162 | Good 16.1% |
| Immigrants | Oceania | 68.4 /100 | #163 | Good 16.1% |
| Immigrants | Colombia | 67.8 /100 | #164 | Good 16.1% |
| Immigrants | Germany | 67.3 /100 | #165 | Good 16.1% |
| South Americans | 67.2 /100 | #166 | Good 16.1% |
| Uruguayans | 64.7 /100 | #167 | Good 16.2% |
| Yugoslavians | 64.4 /100 | #168 | Good 16.2% |
| Costa Ricans | 64.2 /100 | #169 | Good 16.2% |
| Immigrants | Venezuela | 64.2 /100 | #170 | Good 16.2% |
| Immigrants | Saudi Arabia | 64.0 /100 | #171 | Good 16.2% |
| Afghans | 62.3 /100 | #172 | Good 16.2% |
| Immigrants | South America | 55.1 /100 | #173 | Average 16.4% |
| Ethiopians | 50.0 /100 | #174 | Average 16.5% |