Assyrian/Chaldean/Syriac vs Immigrants from Uzbekistan Single Mother Poverty
COMPARE
Assyrian/Chaldean/Syriac
Immigrants from Uzbekistan
Single Mother Poverty
Single Mother Poverty Comparison
Assyrians/Chaldeans/Syriacs
Immigrants from Uzbekistan
23.8%
SINGLE MOTHER POVERTY
100.0/ 100
METRIC RATING
1st/ 347
METRIC RANK
29.3%
SINGLE MOTHER POVERTY
42.6/ 100
METRIC RATING
179th/ 347
METRIC RANK
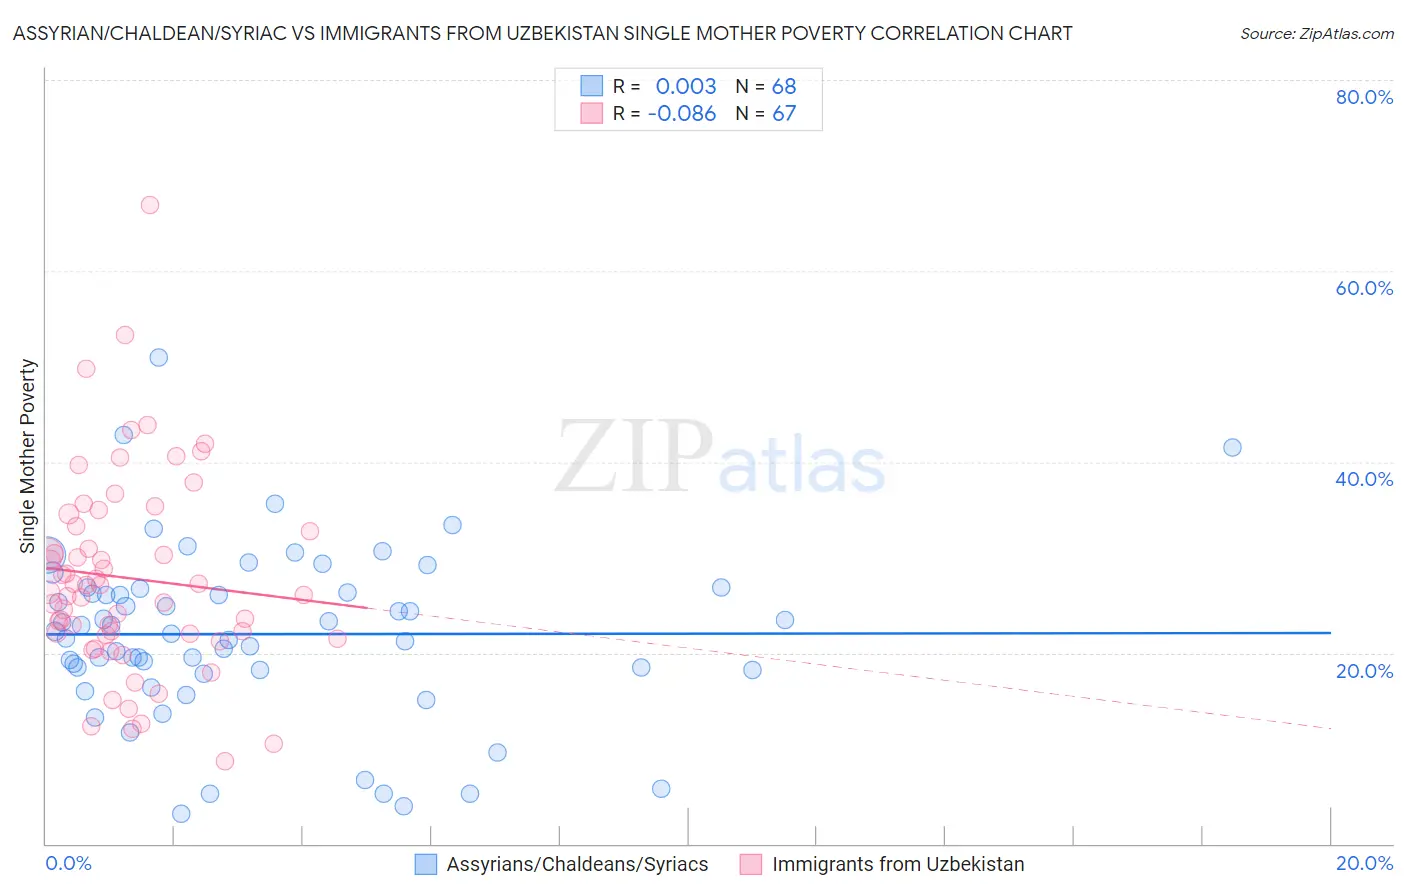
Assyrian/Chaldean/Syriac vs Immigrants from Uzbekistan Single Mother Poverty Correlation Chart
The statistical analysis conducted on geographies consisting of 109,112,991 people shows no correlation between the proportion of Assyrians/Chaldeans/Syriacs and poverty level among single mothers in the United States with a correlation coefficient (R) of 0.003 and weighted average of 23.8%. Similarly, the statistical analysis conducted on geographies consisting of 117,476,483 people shows a slight negative correlation between the proportion of Immigrants from Uzbekistan and poverty level among single mothers in the United States with a correlation coefficient (R) of -0.086 and weighted average of 29.3%, a difference of 23.0%.
Single Mother Poverty Correlation Summary
| Measurement | Assyrian/Chaldean/Syriac | Immigrants from Uzbekistan |
| Minimum | 3.1% | 8.7% |
| Maximum | 50.9% | 67.0% |
| Range | 47.8% | 58.3% |
| Mean | 22.0% | 27.8% |
| Median | 22.1% | 26.3% |
| Interquartile 25% (IQ1) | 18.2% | 21.9% |
| Interquartile 75% (IQ3) | 26.5% | 33.2% |
| Interquartile Range (IQR) | 8.3% | 11.3% |
| Standard Deviation (Sample) | 9.1% | 10.5% |
| Standard Deviation (Population) | 9.0% | 10.4% |
Similar Demographics by Single Mother Poverty
Demographics Similar to Assyrians/Chaldeans/Syriacs by Single Mother Poverty
In terms of single mother poverty, the demographic groups most similar to Assyrians/Chaldeans/Syriacs are Immigrants from India (23.8%, a difference of 0.020%), Immigrants from Taiwan (23.9%, a difference of 0.21%), Filipino (24.3%, a difference of 2.1%), Immigrants from Hong Kong (24.4%, a difference of 2.4%), and Thai (24.5%, a difference of 2.9%).
| Demographics | Rating | Rank | Single Mother Poverty |
| Assyrians/Chaldeans/Syriacs | 100.0 /100 | #1 | Exceptional 23.8% |
| Immigrants | India | 100.0 /100 | #2 | Exceptional 23.8% |
| Immigrants | Taiwan | 100.0 /100 | #3 | Exceptional 23.9% |
| Filipinos | 100.0 /100 | #4 | Exceptional 24.3% |
| Immigrants | Hong Kong | 100.0 /100 | #5 | Exceptional 24.4% |
| Thais | 100.0 /100 | #6 | Exceptional 24.5% |
| Chinese | 100.0 /100 | #7 | Exceptional 24.6% |
| Immigrants | Iran | 100.0 /100 | #8 | Exceptional 25.1% |
| Immigrants | Lithuania | 100.0 /100 | #9 | Exceptional 25.2% |
| Immigrants | South Central Asia | 100.0 /100 | #10 | Exceptional 25.3% |
| Iranians | 100.0 /100 | #11 | Exceptional 25.5% |
| Bhutanese | 100.0 /100 | #12 | Exceptional 25.6% |
| Indians (Asian) | 100.0 /100 | #13 | Exceptional 25.8% |
| Immigrants | Singapore | 100.0 /100 | #14 | Exceptional 25.8% |
| Immigrants | Ireland | 100.0 /100 | #15 | Exceptional 25.8% |
Demographics Similar to Immigrants from Uzbekistan by Single Mother Poverty
In terms of single mother poverty, the demographic groups most similar to Immigrants from Uzbekistan are South American Indian (29.3%, a difference of 0.030%), Immigrants from Norway (29.3%, a difference of 0.050%), Canadian (29.3%, a difference of 0.11%), Immigrants from Bosnia and Herzegovina (29.2%, a difference of 0.12%), and Immigrants from Eastern Africa (29.3%, a difference of 0.20%).
| Demographics | Rating | Rank | Single Mother Poverty |
| Carpatho Rusyns | 53.8 /100 | #172 | Average 29.1% |
| British | 50.6 /100 | #173 | Average 29.2% |
| Immigrants | Saudi Arabia | 50.0 /100 | #174 | Average 29.2% |
| Immigrants | Costa Rica | 48.8 /100 | #175 | Average 29.2% |
| Hawaiians | 47.8 /100 | #176 | Average 29.2% |
| Immigrants | Bosnia and Herzegovina | 45.1 /100 | #177 | Average 29.2% |
| South American Indians | 43.2 /100 | #178 | Average 29.3% |
| Immigrants | Uzbekistan | 42.6 /100 | #179 | Average 29.3% |
| Immigrants | Norway | 41.5 /100 | #180 | Average 29.3% |
| Canadians | 40.4 /100 | #181 | Average 29.3% |
| Immigrants | Eastern Africa | 38.5 /100 | #182 | Fair 29.3% |
| Nepalese | 38.3 /100 | #183 | Fair 29.3% |
| Nigerians | 38.0 /100 | #184 | Fair 29.3% |
| Ghanaians | 36.8 /100 | #185 | Fair 29.4% |
| Yugoslavians | 36.0 /100 | #186 | Fair 29.4% |