Assyrian/Chaldean/Syriac vs Choctaw Single Mother Poverty
COMPARE
Assyrian/Chaldean/Syriac
Choctaw
Single Mother Poverty
Single Mother Poverty Comparison
Assyrians/Chaldeans/Syriacs
Choctaw
23.8%
SINGLE MOTHER POVERTY
100.0/ 100
METRIC RATING
1st/ 347
METRIC RANK
36.4%
SINGLE MOTHER POVERTY
0.0/ 100
METRIC RATING
328th/ 347
METRIC RANK
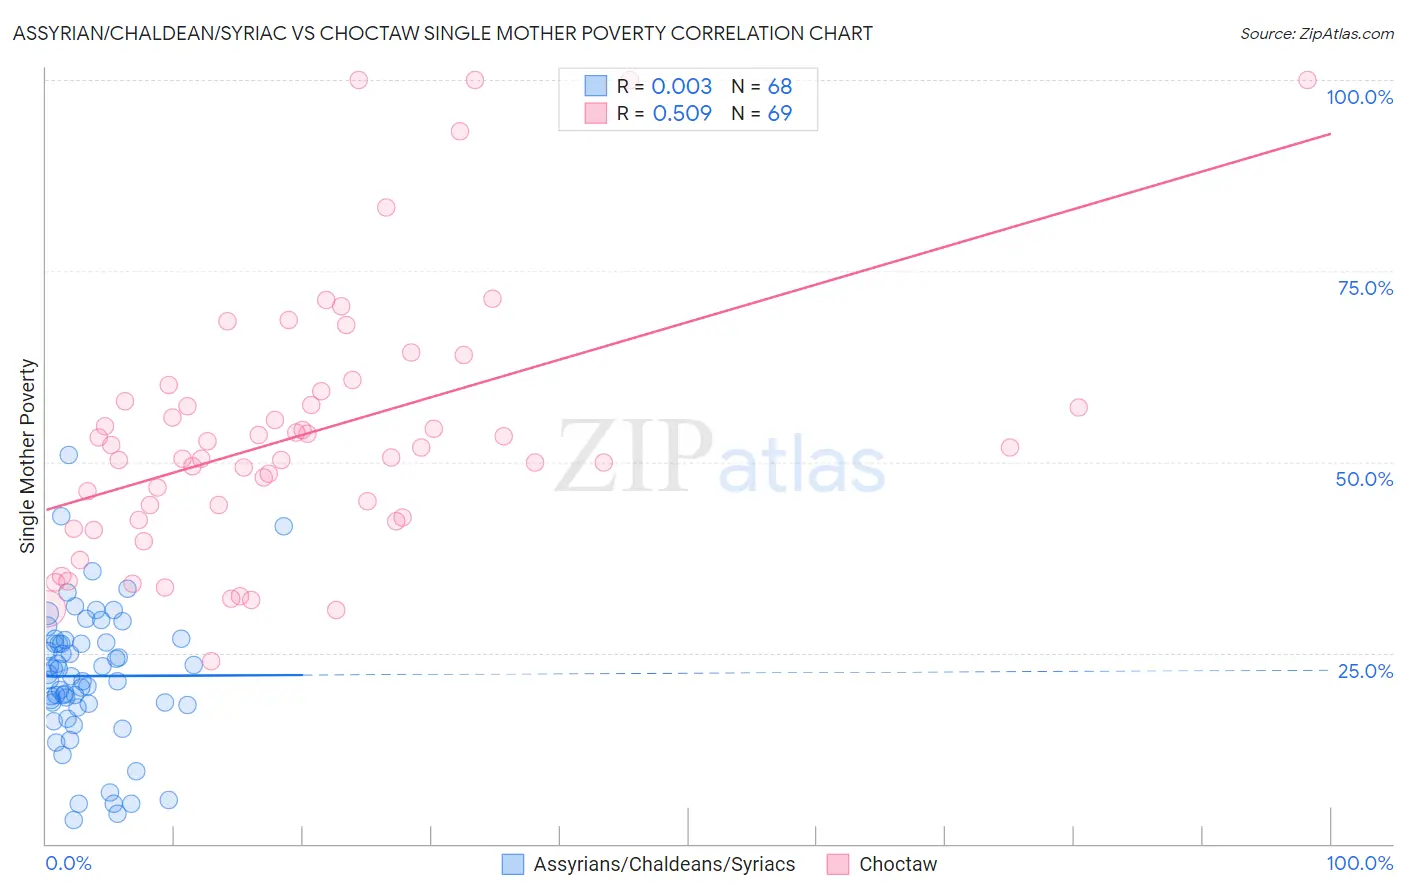
Assyrian/Chaldean/Syriac vs Choctaw Single Mother Poverty Correlation Chart
The statistical analysis conducted on geographies consisting of 109,112,991 people shows no correlation between the proportion of Assyrians/Chaldeans/Syriacs and poverty level among single mothers in the United States with a correlation coefficient (R) of 0.003 and weighted average of 23.8%. Similarly, the statistical analysis conducted on geographies consisting of 266,090,747 people shows a substantial positive correlation between the proportion of Choctaw and poverty level among single mothers in the United States with a correlation coefficient (R) of 0.509 and weighted average of 36.4%, a difference of 53.0%.
Single Mother Poverty Correlation Summary
| Measurement | Assyrian/Chaldean/Syriac | Choctaw |
| Minimum | 3.1% | 24.0% |
| Maximum | 50.9% | 100.0% |
| Range | 47.8% | 76.0% |
| Mean | 22.0% | 53.6% |
| Median | 22.1% | 51.8% |
| Interquartile 25% (IQ1) | 18.2% | 42.5% |
| Interquartile 75% (IQ3) | 26.5% | 58.6% |
| Interquartile Range (IQR) | 8.3% | 16.1% |
| Standard Deviation (Sample) | 9.1% | 17.1% |
| Standard Deviation (Population) | 9.0% | 17.0% |
Similar Demographics by Single Mother Poverty
Demographics Similar to Assyrians/Chaldeans/Syriacs by Single Mother Poverty
In terms of single mother poverty, the demographic groups most similar to Assyrians/Chaldeans/Syriacs are Immigrants from India (23.8%, a difference of 0.020%), Immigrants from Taiwan (23.9%, a difference of 0.21%), Filipino (24.3%, a difference of 2.1%), Immigrants from Hong Kong (24.4%, a difference of 2.4%), and Thai (24.5%, a difference of 2.9%).
| Demographics | Rating | Rank | Single Mother Poverty |
| Assyrians/Chaldeans/Syriacs | 100.0 /100 | #1 | Exceptional 23.8% |
| Immigrants | India | 100.0 /100 | #2 | Exceptional 23.8% |
| Immigrants | Taiwan | 100.0 /100 | #3 | Exceptional 23.9% |
| Filipinos | 100.0 /100 | #4 | Exceptional 24.3% |
| Immigrants | Hong Kong | 100.0 /100 | #5 | Exceptional 24.4% |
| Thais | 100.0 /100 | #6 | Exceptional 24.5% |
| Chinese | 100.0 /100 | #7 | Exceptional 24.6% |
| Immigrants | Iran | 100.0 /100 | #8 | Exceptional 25.1% |
| Immigrants | Lithuania | 100.0 /100 | #9 | Exceptional 25.2% |
| Immigrants | South Central Asia | 100.0 /100 | #10 | Exceptional 25.3% |
| Iranians | 100.0 /100 | #11 | Exceptional 25.5% |
| Bhutanese | 100.0 /100 | #12 | Exceptional 25.6% |
| Indians (Asian) | 100.0 /100 | #13 | Exceptional 25.8% |
| Immigrants | Singapore | 100.0 /100 | #14 | Exceptional 25.8% |
| Immigrants | Ireland | 100.0 /100 | #15 | Exceptional 25.8% |
Demographics Similar to Choctaw by Single Mother Poverty
In terms of single mother poverty, the demographic groups most similar to Choctaw are Yakama (36.4%, a difference of 0.060%), Apache (36.6%, a difference of 0.48%), Native/Alaskan (36.6%, a difference of 0.58%), Creek (36.7%, a difference of 0.74%), and Dutch West Indian (36.8%, a difference of 0.98%).
| Demographics | Rating | Rank | Single Mother Poverty |
| Paiute | 0.0 /100 | #321 | Tragic 35.1% |
| Blacks/African Americans | 0.0 /100 | #322 | Tragic 35.2% |
| Kiowa | 0.0 /100 | #323 | Tragic 35.5% |
| Ottawa | 0.0 /100 | #324 | Tragic 35.5% |
| Ute | 0.0 /100 | #325 | Tragic 35.7% |
| Seminole | 0.0 /100 | #326 | Tragic 35.8% |
| Yakama | 0.0 /100 | #327 | Tragic 36.4% |
| Choctaw | 0.0 /100 | #328 | Tragic 36.4% |
| Apache | 0.0 /100 | #329 | Tragic 36.6% |
| Natives/Alaskans | 0.0 /100 | #330 | Tragic 36.6% |
| Creek | 0.0 /100 | #331 | Tragic 36.7% |
| Dutch West Indians | 0.0 /100 | #332 | Tragic 36.8% |
| Menominee | 0.0 /100 | #333 | Tragic 37.1% |
| Pueblo | 0.0 /100 | #334 | Tragic 37.2% |
| Yuman | 0.0 /100 | #335 | Tragic 37.8% |