Asian vs Soviet Union Female Poverty
COMPARE
Asian
Soviet Union
Female Poverty
Female Poverty Comparison
Asians
Soviet Union
11.9%
FEMALE POVERTY
99.1/ 100
METRIC RATING
47th/ 347
METRIC RANK
12.6%
FEMALE POVERTY
92.4/ 100
METRIC RATING
111th/ 347
METRIC RANK
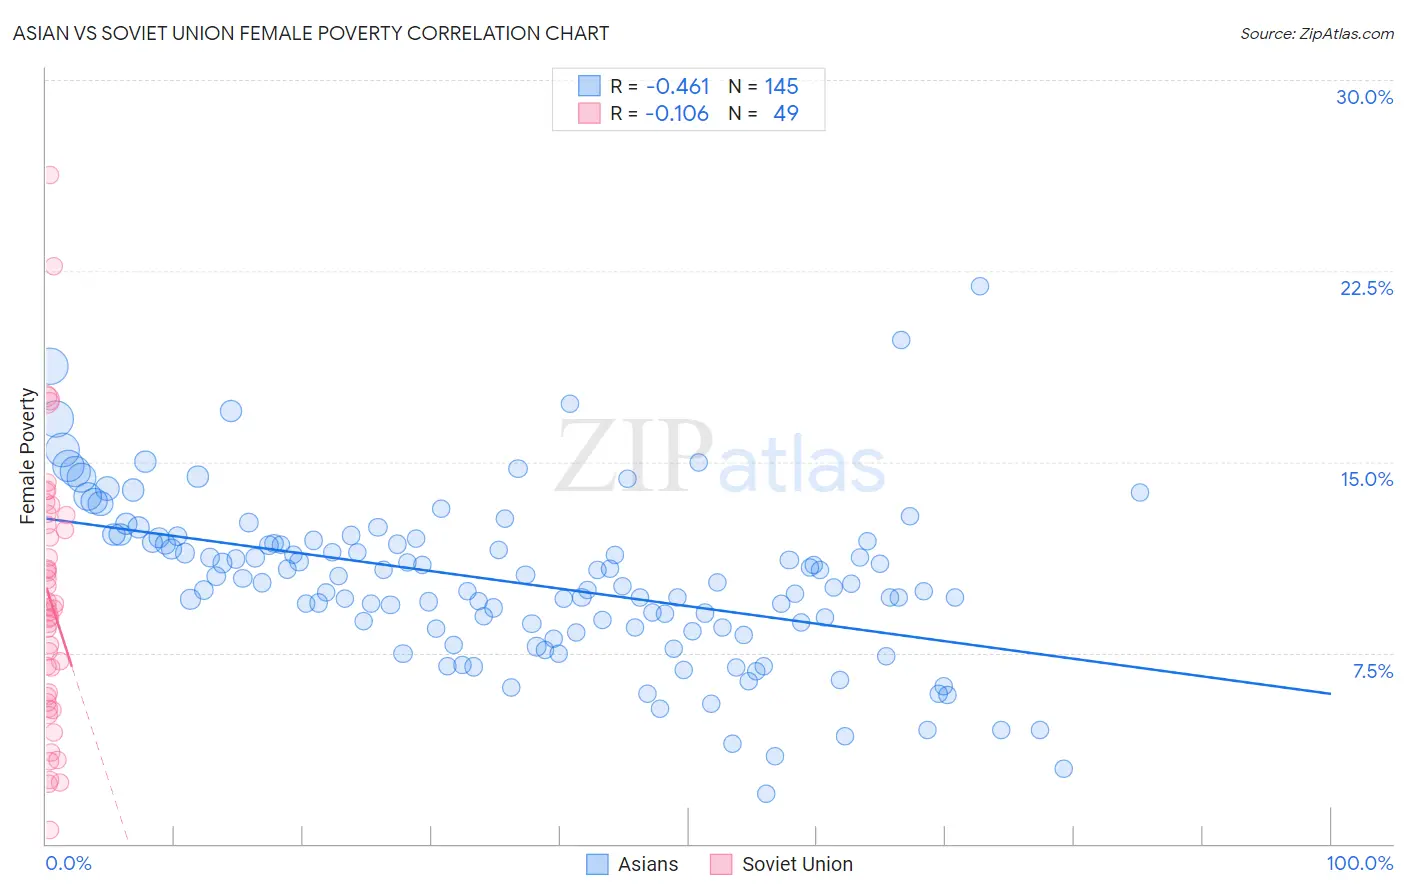
Asian vs Soviet Union Female Poverty Correlation Chart
The statistical analysis conducted on geographies consisting of 549,886,989 people shows a moderate negative correlation between the proportion of Asians and poverty level among females in the United States with a correlation coefficient (R) of -0.461 and weighted average of 11.9%. Similarly, the statistical analysis conducted on geographies consisting of 43,449,399 people shows a poor negative correlation between the proportion of Soviet Union and poverty level among females in the United States with a correlation coefficient (R) of -0.106 and weighted average of 12.6%, a difference of 6.0%.
Female Poverty Correlation Summary
| Measurement | Asian | Soviet Union |
| Minimum | 1.9% | 0.56% |
| Maximum | 21.9% | 26.3% |
| Range | 20.0% | 25.7% |
| Mean | 10.3% | 9.6% |
| Median | 10.2% | 9.2% |
| Interquartile 25% (IQ1) | 8.5% | 5.7% |
| Interquartile 75% (IQ3) | 11.9% | 12.7% |
| Interquartile Range (IQR) | 3.4% | 7.0% |
| Standard Deviation (Sample) | 3.2% | 5.2% |
| Standard Deviation (Population) | 3.2% | 5.1% |
Similar Demographics by Female Poverty
Demographics Similar to Asians by Female Poverty
In terms of female poverty, the demographic groups most similar to Asians are Turkish (11.9%, a difference of 0.21%), Immigrants from Czechoslovakia (11.9%, a difference of 0.22%), Immigrants from Japan (11.9%, a difference of 0.23%), Tongan (11.9%, a difference of 0.31%), and Korean (11.9%, a difference of 0.38%).
| Demographics | Rating | Rank | Female Poverty |
| Macedonians | 99.3 /100 | #40 | Exceptional 11.8% |
| Czechs | 99.2 /100 | #41 | Exceptional 11.9% |
| Immigrants | Moldova | 99.2 /100 | #42 | Exceptional 11.9% |
| Koreans | 99.2 /100 | #43 | Exceptional 11.9% |
| Tongans | 99.2 /100 | #44 | Exceptional 11.9% |
| Immigrants | Czechoslovakia | 99.2 /100 | #45 | Exceptional 11.9% |
| Turks | 99.2 /100 | #46 | Exceptional 11.9% |
| Asians | 99.1 /100 | #47 | Exceptional 11.9% |
| Immigrants | Japan | 99.0 /100 | #48 | Exceptional 11.9% |
| Immigrants | Romania | 99.0 /100 | #49 | Exceptional 12.0% |
| Slovenes | 98.9 /100 | #50 | Exceptional 12.0% |
| Immigrants | Bulgaria | 98.9 /100 | #51 | Exceptional 12.0% |
| Immigrants | Croatia | 98.7 /100 | #52 | Exceptional 12.0% |
| Immigrants | Austria | 98.7 /100 | #53 | Exceptional 12.0% |
| Immigrants | Philippines | 98.7 /100 | #54 | Exceptional 12.1% |
Demographics Similar to Soviet Union by Female Poverty
In terms of female poverty, the demographic groups most similar to Soviet Union are Immigrants from Israel (12.6%, a difference of 0.14%), Canadian (12.7%, a difference of 0.17%), Paraguayan (12.6%, a difference of 0.22%), Immigrants from Zimbabwe (12.6%, a difference of 0.25%), and Portuguese (12.6%, a difference of 0.27%).
| Demographics | Rating | Rank | Female Poverty |
| Palestinians | 94.3 /100 | #104 | Exceptional 12.5% |
| Scottish | 94.1 /100 | #105 | Exceptional 12.5% |
| Immigrants | Turkey | 93.8 /100 | #106 | Exceptional 12.6% |
| Laotians | 93.4 /100 | #107 | Exceptional 12.6% |
| Portuguese | 93.1 /100 | #108 | Exceptional 12.6% |
| Immigrants | Zimbabwe | 93.1 /100 | #109 | Exceptional 12.6% |
| Paraguayans | 93.0 /100 | #110 | Exceptional 12.6% |
| Soviet Union | 92.4 /100 | #111 | Exceptional 12.6% |
| Immigrants | Israel | 92.0 /100 | #112 | Exceptional 12.6% |
| Canadians | 92.0 /100 | #113 | Exceptional 12.7% |
| Welsh | 91.6 /100 | #114 | Exceptional 12.7% |
| Puget Sound Salish | 91.5 /100 | #115 | Exceptional 12.7% |
| Immigrants | Russia | 91.2 /100 | #116 | Exceptional 12.7% |
| Immigrants | Southern Europe | 90.9 /100 | #117 | Exceptional 12.7% |
| Sri Lankans | 90.9 /100 | #118 | Exceptional 12.7% |