Asian vs Soviet Union Vision Disability
COMPARE
Asian
Soviet Union
Vision Disability
Vision Disability Comparison
Asians
Soviet Union
1.9%
VISION DISABILITY
100.0/ 100
METRIC RATING
20th/ 347
METRIC RANK
2.0%
VISION DISABILITY
97.6/ 100
METRIC RATING
81st/ 347
METRIC RANK
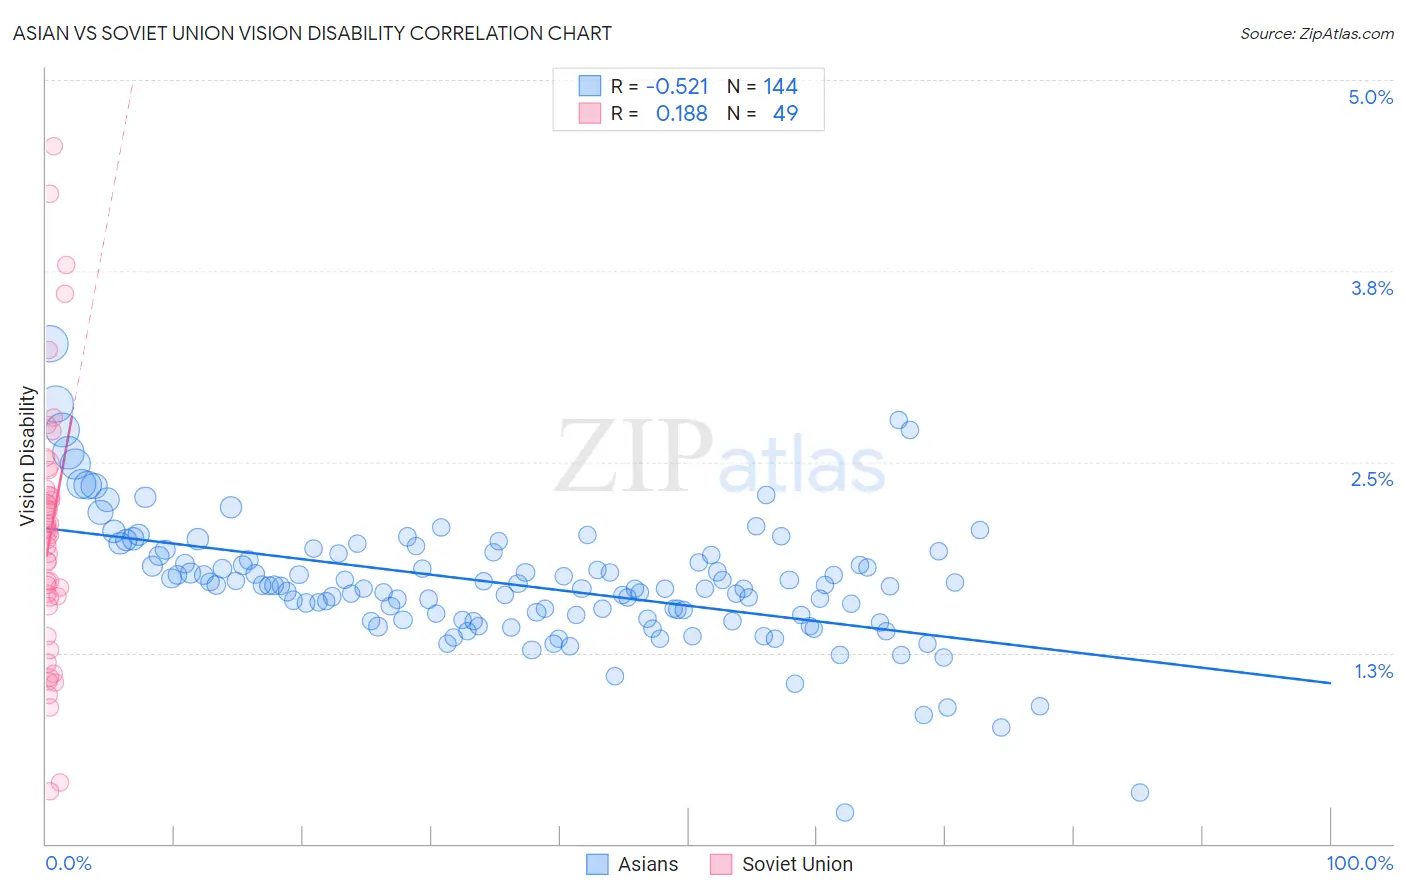
Asian vs Soviet Union Vision Disability Correlation Chart
The statistical analysis conducted on geographies consisting of 549,556,904 people shows a substantial negative correlation between the proportion of Asians and percentage of population with vision disability in the United States with a correlation coefficient (R) of -0.521 and weighted average of 1.9%. Similarly, the statistical analysis conducted on geographies consisting of 43,504,651 people shows a poor positive correlation between the proportion of Soviet Union and percentage of population with vision disability in the United States with a correlation coefficient (R) of 0.188 and weighted average of 2.0%, a difference of 7.3%.
Vision Disability Correlation Summary
| Measurement | Asian | Soviet Union |
| Minimum | 0.21% | 0.35% |
| Maximum | 3.3% | 4.6% |
| Range | 3.1% | 4.2% |
| Mean | 1.7% | 2.0% |
| Median | 1.7% | 2.0% |
| Interquartile 25% (IQ1) | 1.5% | 1.6% |
| Interquartile 75% (IQ3) | 1.9% | 2.3% |
| Interquartile Range (IQR) | 0.42% | 0.72% |
| Standard Deviation (Sample) | 0.41% | 0.86% |
| Standard Deviation (Population) | 0.41% | 0.85% |
Similar Demographics by Vision Disability
Demographics Similar to Asians by Vision Disability
In terms of vision disability, the demographic groups most similar to Asians are Turkish (1.9%, a difference of 0.31%), Immigrants from Pakistan (1.9%, a difference of 0.35%), Immigrants from Asia (1.9%, a difference of 0.89%), Immigrants from Lithuania (1.9%, a difference of 1.0%), and Bulgarian (1.9%, a difference of 1.1%).
| Demographics | Rating | Rank | Vision Disability |
| Immigrants | Eastern Asia | 100.0 /100 | #13 | Exceptional 1.8% |
| Immigrants | China | 100.0 /100 | #14 | Exceptional 1.8% |
| Immigrants | Bolivia | 100.0 /100 | #15 | Exceptional 1.8% |
| Indians (Asian) | 100.0 /100 | #16 | Exceptional 1.8% |
| Burmese | 100.0 /100 | #17 | Exceptional 1.8% |
| Bolivians | 100.0 /100 | #18 | Exceptional 1.9% |
| Immigrants | Sri Lanka | 100.0 /100 | #19 | Exceptional 1.9% |
| Asians | 100.0 /100 | #20 | Exceptional 1.9% |
| Turks | 100.0 /100 | #21 | Exceptional 1.9% |
| Immigrants | Pakistan | 100.0 /100 | #22 | Exceptional 1.9% |
| Immigrants | Asia | 99.9 /100 | #23 | Exceptional 1.9% |
| Immigrants | Lithuania | 99.9 /100 | #24 | Exceptional 1.9% |
| Bulgarians | 99.9 /100 | #25 | Exceptional 1.9% |
| Immigrants | Japan | 99.9 /100 | #26 | Exceptional 1.9% |
| Taiwanese | 99.9 /100 | #27 | Exceptional 1.9% |
Demographics Similar to Soviet Union by Vision Disability
In terms of vision disability, the demographic groups most similar to Soviet Union are Immigrants from Poland (2.0%, a difference of 0.020%), Lithuanian (2.0%, a difference of 0.060%), Immigrants from Western Asia (2.0%, a difference of 0.11%), Immigrants from Latvia (2.0%, a difference of 0.22%), and Chinese (2.0%, a difference of 0.28%).
| Demographics | Rating | Rank | Vision Disability |
| Palestinians | 98.3 /100 | #74 | Exceptional 2.0% |
| Immigrants | North Macedonia | 98.3 /100 | #75 | Exceptional 2.0% |
| Paraguayans | 98.3 /100 | #76 | Exceptional 2.0% |
| Immigrants | Jordan | 98.3 /100 | #77 | Exceptional 2.0% |
| Immigrants | Eastern Europe | 98.3 /100 | #78 | Exceptional 2.0% |
| Assyrians/Chaldeans/Syriacs | 98.1 /100 | #79 | Exceptional 2.0% |
| Lithuanians | 97.7 /100 | #80 | Exceptional 2.0% |
| Soviet Union | 97.6 /100 | #81 | Exceptional 2.0% |
| Immigrants | Poland | 97.6 /100 | #82 | Exceptional 2.0% |
| Immigrants | Western Asia | 97.5 /100 | #83 | Exceptional 2.0% |
| Immigrants | Latvia | 97.3 /100 | #84 | Exceptional 2.0% |
| Chinese | 97.2 /100 | #85 | Exceptional 2.0% |
| Immigrants | Moldova | 97.2 /100 | #86 | Exceptional 2.0% |
| Immigrants | Switzerland | 97.0 /100 | #87 | Exceptional 2.0% |
| Norwegians | 97.0 /100 | #88 | Exceptional 2.0% |