Asian vs U.S. Virgin Islander Female Poverty
COMPARE
Asian
U.S. Virgin Islander
Female Poverty
Female Poverty Comparison
Asians
U.S. Virgin Islanders
11.9%
FEMALE POVERTY
99.1/ 100
METRIC RATING
47th/ 347
METRIC RANK
17.3%
FEMALE POVERTY
0.0/ 100
METRIC RATING
315th/ 347
METRIC RANK
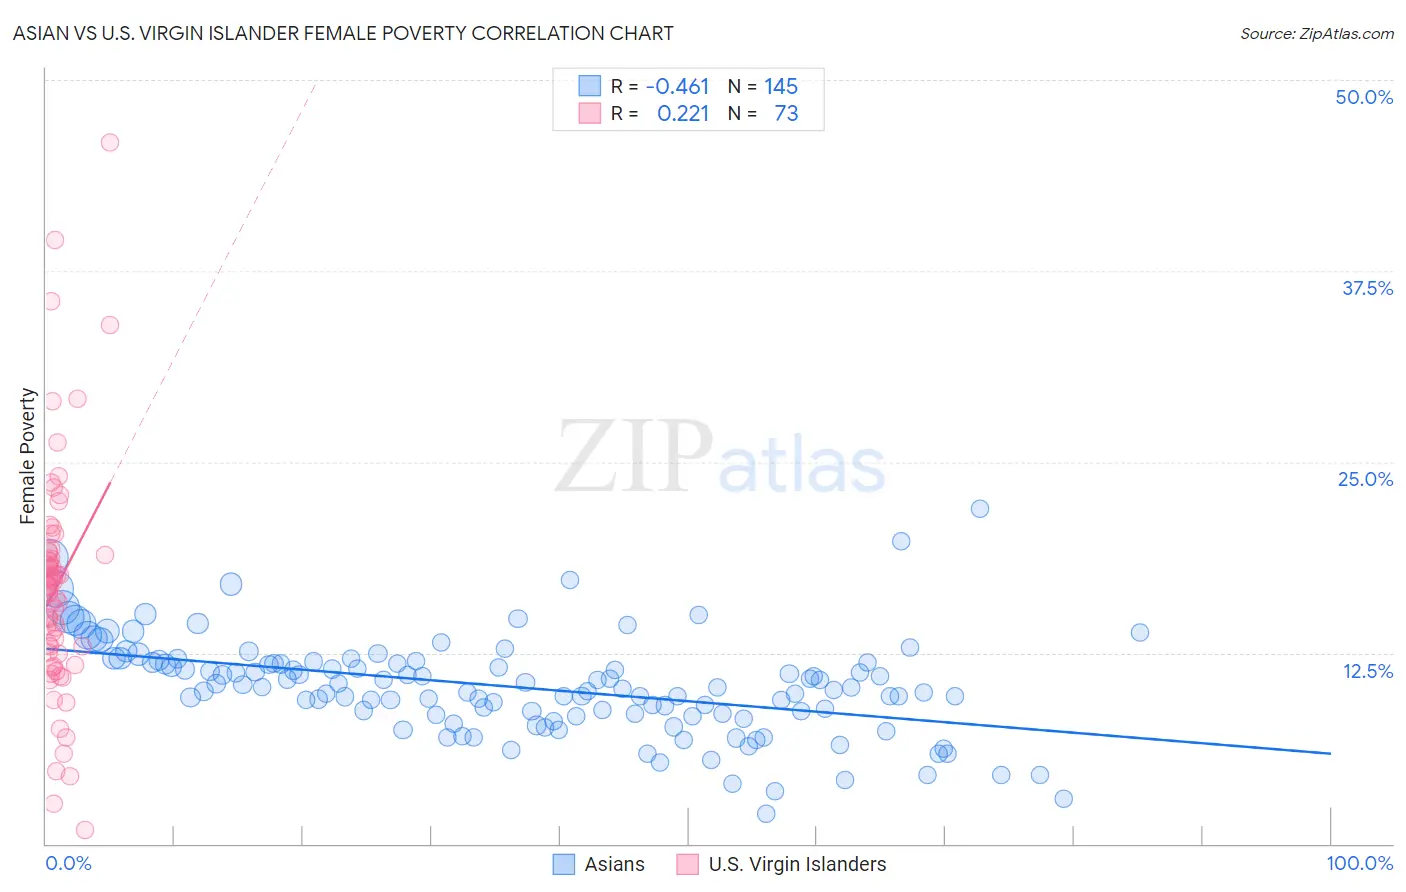
Asian vs U.S. Virgin Islander Female Poverty Correlation Chart
The statistical analysis conducted on geographies consisting of 549,886,989 people shows a moderate negative correlation between the proportion of Asians and poverty level among females in the United States with a correlation coefficient (R) of -0.461 and weighted average of 11.9%. Similarly, the statistical analysis conducted on geographies consisting of 87,511,950 people shows a weak positive correlation between the proportion of U.S. Virgin Islanders and poverty level among females in the United States with a correlation coefficient (R) of 0.221 and weighted average of 17.3%, a difference of 45.2%.
Female Poverty Correlation Summary
| Measurement | Asian | U.S. Virgin Islander |
| Minimum | 1.9% | 0.93% |
| Maximum | 21.9% | 45.9% |
| Range | 20.0% | 45.0% |
| Mean | 10.3% | 16.9% |
| Median | 10.2% | 16.8% |
| Interquartile 25% (IQ1) | 8.5% | 12.5% |
| Interquartile 75% (IQ3) | 11.9% | 19.1% |
| Interquartile Range (IQR) | 3.4% | 6.6% |
| Standard Deviation (Sample) | 3.2% | 7.7% |
| Standard Deviation (Population) | 3.2% | 7.6% |
Similar Demographics by Female Poverty
Demographics Similar to Asians by Female Poverty
In terms of female poverty, the demographic groups most similar to Asians are Turkish (11.9%, a difference of 0.21%), Immigrants from Czechoslovakia (11.9%, a difference of 0.22%), Immigrants from Japan (11.9%, a difference of 0.23%), Tongan (11.9%, a difference of 0.31%), and Korean (11.9%, a difference of 0.38%).
| Demographics | Rating | Rank | Female Poverty |
| Macedonians | 99.3 /100 | #40 | Exceptional 11.8% |
| Czechs | 99.2 /100 | #41 | Exceptional 11.9% |
| Immigrants | Moldova | 99.2 /100 | #42 | Exceptional 11.9% |
| Koreans | 99.2 /100 | #43 | Exceptional 11.9% |
| Tongans | 99.2 /100 | #44 | Exceptional 11.9% |
| Immigrants | Czechoslovakia | 99.2 /100 | #45 | Exceptional 11.9% |
| Turks | 99.2 /100 | #46 | Exceptional 11.9% |
| Asians | 99.1 /100 | #47 | Exceptional 11.9% |
| Immigrants | Japan | 99.0 /100 | #48 | Exceptional 11.9% |
| Immigrants | Romania | 99.0 /100 | #49 | Exceptional 12.0% |
| Slovenes | 98.9 /100 | #50 | Exceptional 12.0% |
| Immigrants | Bulgaria | 98.9 /100 | #51 | Exceptional 12.0% |
| Immigrants | Croatia | 98.7 /100 | #52 | Exceptional 12.0% |
| Immigrants | Austria | 98.7 /100 | #53 | Exceptional 12.0% |
| Immigrants | Philippines | 98.7 /100 | #54 | Exceptional 12.1% |
Demographics Similar to U.S. Virgin Islanders by Female Poverty
In terms of female poverty, the demographic groups most similar to U.S. Virgin Islanders are Honduran (17.4%, a difference of 0.30%), Immigrants from Congo (17.4%, a difference of 0.49%), Ute (17.5%, a difference of 0.82%), Cajun (17.5%, a difference of 0.83%), and Immigrants from Dominica (17.5%, a difference of 0.91%).
| Demographics | Rating | Rank | Female Poverty |
| Africans | 0.0 /100 | #308 | Tragic 16.9% |
| Immigrants | Mexico | 0.0 /100 | #309 | Tragic 17.0% |
| Creek | 0.0 /100 | #310 | Tragic 17.0% |
| Immigrants | Guatemala | 0.0 /100 | #311 | Tragic 17.0% |
| Immigrants | Somalia | 0.0 /100 | #312 | Tragic 17.0% |
| British West Indians | 0.0 /100 | #313 | Tragic 17.0% |
| Dutch West Indians | 0.0 /100 | #314 | Tragic 17.1% |
| U.S. Virgin Islanders | 0.0 /100 | #315 | Tragic 17.3% |
| Hondurans | 0.0 /100 | #316 | Tragic 17.4% |
| Immigrants | Congo | 0.0 /100 | #317 | Tragic 17.4% |
| Ute | 0.0 /100 | #318 | Tragic 17.5% |
| Cajuns | 0.0 /100 | #319 | Tragic 17.5% |
| Immigrants | Dominica | 0.0 /100 | #320 | Tragic 17.5% |
| Arapaho | 0.0 /100 | #321 | Tragic 17.5% |
| Menominee | 0.0 /100 | #322 | Tragic 17.6% |