Asian vs Soviet Union Median Female Earnings
COMPARE
Asian
Soviet Union
Median Female Earnings
Median Female Earnings Comparison
Asians
Soviet Union
$44,586
MEDIAN FEMALE EARNINGS
100.0/ 100
METRIC RATING
30th/ 347
METRIC RANK
$46,556
MEDIAN FEMALE EARNINGS
100.0/ 100
METRIC RATING
14th/ 347
METRIC RANK
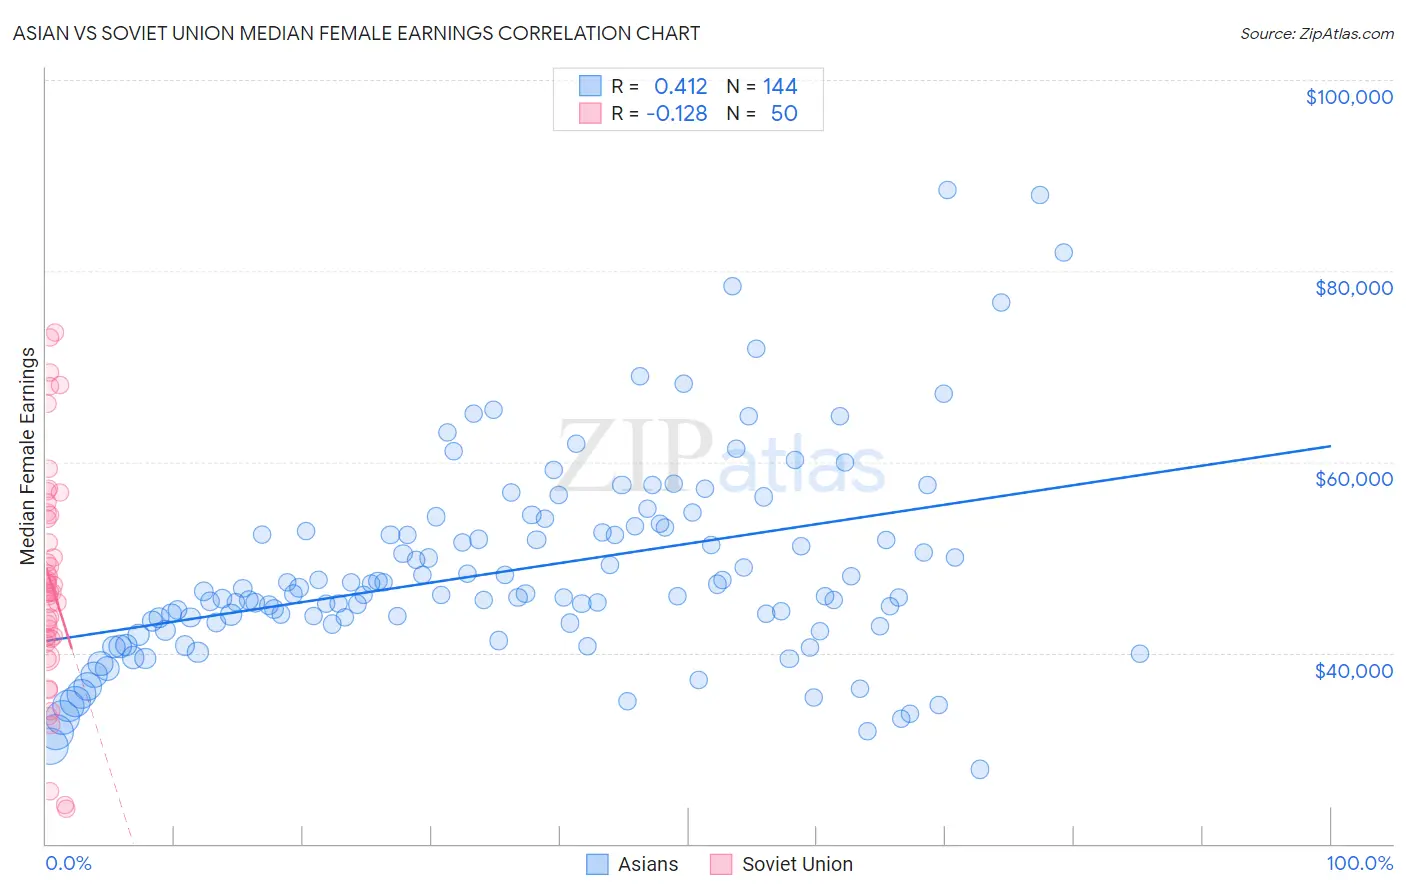
Asian vs Soviet Union Median Female Earnings Correlation Chart
The statistical analysis conducted on geographies consisting of 549,997,902 people shows a moderate positive correlation between the proportion of Asians and median female earnings in the United States with a correlation coefficient (R) of 0.412 and weighted average of $44,586. Similarly, the statistical analysis conducted on geographies consisting of 43,506,452 people shows a poor negative correlation between the proportion of Soviet Union and median female earnings in the United States with a correlation coefficient (R) of -0.128 and weighted average of $46,556, a difference of 4.4%.
Median Female Earnings Correlation Summary
| Measurement | Asian | Soviet Union |
| Minimum | $27,791 | $23,611 |
| Maximum | $88,421 | $73,520 |
| Range | $60,630 | $49,909 |
| Mean | $48,672 | $47,577 |
| Median | $46,136 | $46,321 |
| Interquartile 25% (IQ1) | $43,055 | $41,646 |
| Interquartile 75% (IQ3) | $52,970 | $54,381 |
| Interquartile Range (IQR) | $9,915 | $12,735 |
| Standard Deviation (Sample) | $10,662 | $11,528 |
| Standard Deviation (Population) | $10,625 | $11,412 |
Demographics Similar to Asians and Soviet Union by Median Female Earnings
In terms of median female earnings, the demographic groups most similar to Asians are Immigrants from Belgium ($44,587, a difference of 0.0%), Immigrants from France ($44,541, a difference of 0.10%), Immigrants from Russia ($44,680, a difference of 0.21%), Turkish ($44,695, a difference of 0.24%), and Immigrants from Belarus ($44,757, a difference of 0.38%). Similarly, the demographic groups most similar to Soviet Union are Immigrants from Australia ($46,573, a difference of 0.040%), Immigrants from Eastern Asia ($46,502, a difference of 0.11%), Indian (Asian) ($46,481, a difference of 0.16%), Immigrants from South Central Asia ($46,324, a difference of 0.50%), and Immigrants from Israel ($46,902, a difference of 0.74%).
| Demographics | Rating | Rank | Median Female Earnings |
| Immigrants | Israel | 100.0 /100 | #12 | Exceptional $46,902 |
| Immigrants | Australia | 100.0 /100 | #13 | Exceptional $46,573 |
| Soviet Union | 100.0 /100 | #14 | Exceptional $46,556 |
| Immigrants | Eastern Asia | 100.0 /100 | #15 | Exceptional $46,502 |
| Indians (Asian) | 100.0 /100 | #16 | Exceptional $46,481 |
| Immigrants | South Central Asia | 100.0 /100 | #17 | Exceptional $46,324 |
| Cypriots | 100.0 /100 | #18 | Exceptional $45,570 |
| Eastern Europeans | 100.0 /100 | #19 | Exceptional $45,385 |
| Immigrants | Japan | 100.0 /100 | #20 | Exceptional $45,323 |
| Cambodians | 100.0 /100 | #21 | Exceptional $45,014 |
| Immigrants | Greece | 100.0 /100 | #22 | Exceptional $44,976 |
| Burmese | 100.0 /100 | #23 | Exceptional $44,911 |
| Immigrants | Korea | 100.0 /100 | #24 | Exceptional $44,847 |
| Immigrants | Sweden | 100.0 /100 | #25 | Exceptional $44,774 |
| Immigrants | Belarus | 100.0 /100 | #26 | Exceptional $44,757 |
| Turks | 100.0 /100 | #27 | Exceptional $44,695 |
| Immigrants | Russia | 100.0 /100 | #28 | Exceptional $44,680 |
| Immigrants | Belgium | 100.0 /100 | #29 | Exceptional $44,587 |
| Asians | 100.0 /100 | #30 | Exceptional $44,586 |
| Immigrants | France | 100.0 /100 | #31 | Exceptional $44,541 |
| Immigrants | Northern Europe | 100.0 /100 | #32 | Exceptional $44,366 |