Asian vs Immigrants from Morocco Female Poverty
COMPARE
Asian
Immigrants from Morocco
Female Poverty
Female Poverty Comparison
Asians
Immigrants from Morocco
11.9%
FEMALE POVERTY
99.1/ 100
METRIC RATING
47th/ 347
METRIC RANK
13.4%
FEMALE POVERTY
49.4/ 100
METRIC RATING
177th/ 347
METRIC RANK
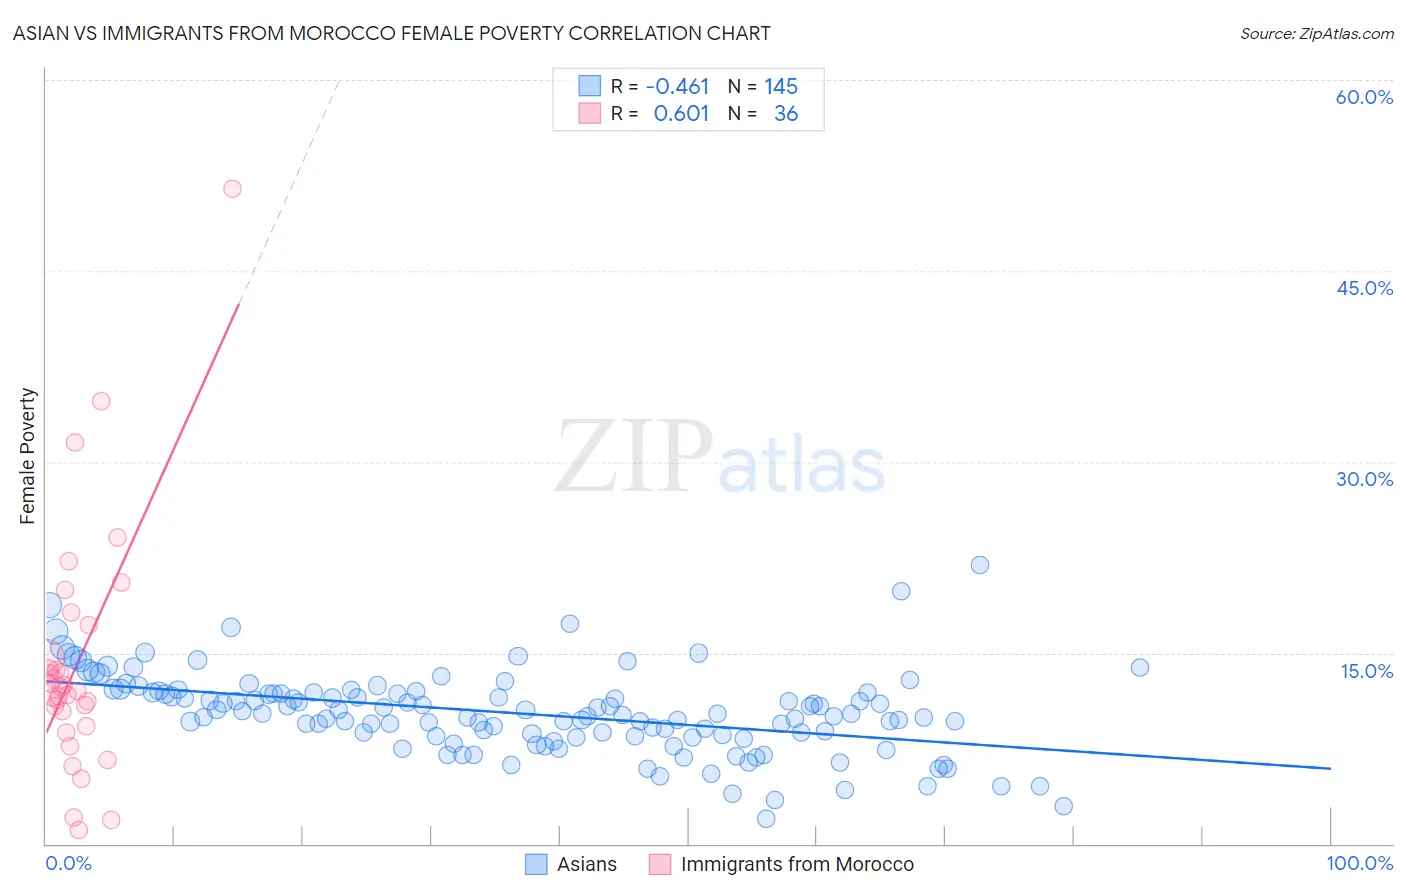
Asian vs Immigrants from Morocco Female Poverty Correlation Chart
The statistical analysis conducted on geographies consisting of 549,886,989 people shows a moderate negative correlation between the proportion of Asians and poverty level among females in the United States with a correlation coefficient (R) of -0.461 and weighted average of 11.9%. Similarly, the statistical analysis conducted on geographies consisting of 178,904,508 people shows a significant positive correlation between the proportion of Immigrants from Morocco and poverty level among females in the United States with a correlation coefficient (R) of 0.601 and weighted average of 13.4%, a difference of 12.8%.
Female Poverty Correlation Summary
| Measurement | Asian | Immigrants from Morocco |
| Minimum | 1.9% | 1.1% |
| Maximum | 21.9% | 51.5% |
| Range | 20.0% | 50.4% |
| Mean | 10.3% | 14.1% |
| Median | 10.2% | 12.1% |
| Interquartile 25% (IQ1) | 8.5% | 9.8% |
| Interquartile 75% (IQ3) | 11.9% | 15.9% |
| Interquartile Range (IQR) | 3.4% | 6.1% |
| Standard Deviation (Sample) | 3.2% | 9.6% |
| Standard Deviation (Population) | 3.2% | 9.5% |
Similar Demographics by Female Poverty
Demographics Similar to Asians by Female Poverty
In terms of female poverty, the demographic groups most similar to Asians are Turkish (11.9%, a difference of 0.21%), Immigrants from Czechoslovakia (11.9%, a difference of 0.22%), Immigrants from Japan (11.9%, a difference of 0.23%), Tongan (11.9%, a difference of 0.31%), and Korean (11.9%, a difference of 0.38%).
| Demographics | Rating | Rank | Female Poverty |
| Macedonians | 99.3 /100 | #40 | Exceptional 11.8% |
| Czechs | 99.2 /100 | #41 | Exceptional 11.9% |
| Immigrants | Moldova | 99.2 /100 | #42 | Exceptional 11.9% |
| Koreans | 99.2 /100 | #43 | Exceptional 11.9% |
| Tongans | 99.2 /100 | #44 | Exceptional 11.9% |
| Immigrants | Czechoslovakia | 99.2 /100 | #45 | Exceptional 11.9% |
| Turks | 99.2 /100 | #46 | Exceptional 11.9% |
| Asians | 99.1 /100 | #47 | Exceptional 11.9% |
| Immigrants | Japan | 99.0 /100 | #48 | Exceptional 11.9% |
| Immigrants | Romania | 99.0 /100 | #49 | Exceptional 12.0% |
| Slovenes | 98.9 /100 | #50 | Exceptional 12.0% |
| Immigrants | Bulgaria | 98.9 /100 | #51 | Exceptional 12.0% |
| Immigrants | Croatia | 98.7 /100 | #52 | Exceptional 12.0% |
| Immigrants | Austria | 98.7 /100 | #53 | Exceptional 12.0% |
| Immigrants | Philippines | 98.7 /100 | #54 | Exceptional 12.1% |
Demographics Similar to Immigrants from Morocco by Female Poverty
In terms of female poverty, the demographic groups most similar to Immigrants from Morocco are Israeli (13.5%, a difference of 0.030%), Immigrants from Spain (13.4%, a difference of 0.040%), Celtic (13.4%, a difference of 0.050%), Immigrants from Iraq (13.4%, a difference of 0.060%), and Immigrants from Syria (13.5%, a difference of 0.060%).
| Demographics | Rating | Rank | Female Poverty |
| Colombians | 55.7 /100 | #170 | Average 13.4% |
| Whites/Caucasians | 54.6 /100 | #171 | Average 13.4% |
| Mongolians | 53.6 /100 | #172 | Average 13.4% |
| Immigrants | Afghanistan | 50.8 /100 | #173 | Average 13.4% |
| Immigrants | Iraq | 50.0 /100 | #174 | Average 13.4% |
| Celtics | 49.9 /100 | #175 | Average 13.4% |
| Immigrants | Spain | 49.9 /100 | #176 | Average 13.4% |
| Immigrants | Morocco | 49.4 /100 | #177 | Average 13.4% |
| Israelis | 49.1 /100 | #178 | Average 13.5% |
| Immigrants | Syria | 48.8 /100 | #179 | Average 13.5% |
| South Americans | 44.8 /100 | #180 | Average 13.5% |
| Venezuelans | 44.5 /100 | #181 | Average 13.5% |
| Immigrants | Colombia | 44.5 /100 | #182 | Average 13.5% |
| Kenyans | 43.8 /100 | #183 | Average 13.5% |
| Immigrants | Sierra Leone | 43.2 /100 | #184 | Average 13.5% |