Cree vs Soviet Union Female Poverty
COMPARE
Cree
Soviet Union
Female Poverty
Female Poverty Comparison
Cree
Soviet Union
15.1%
FEMALE POVERTY
0.7/ 100
METRIC RATING
236th/ 347
METRIC RANK
12.6%
FEMALE POVERTY
92.4/ 100
METRIC RATING
111th/ 347
METRIC RANK
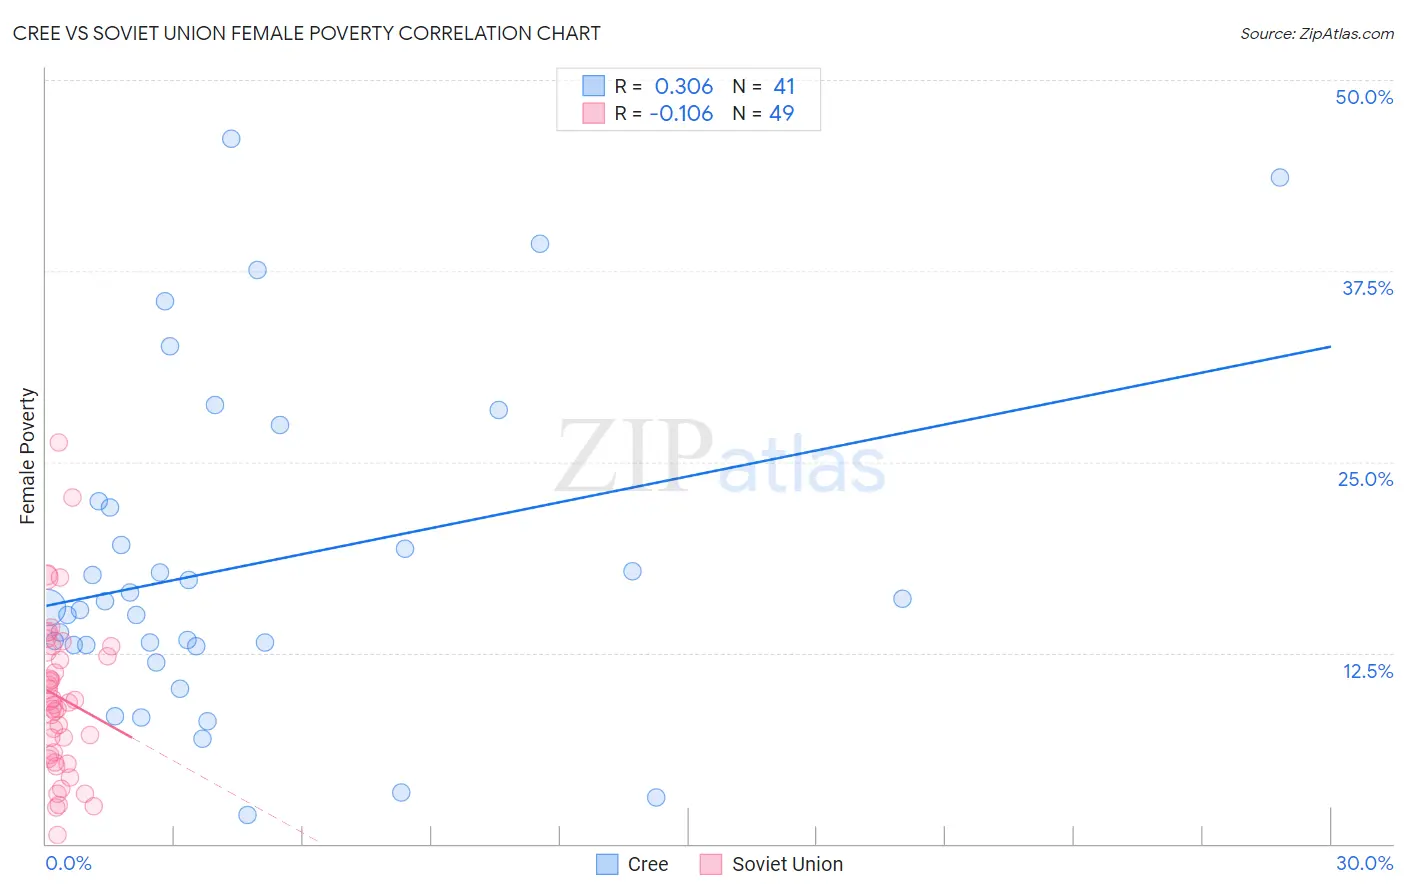
Cree vs Soviet Union Female Poverty Correlation Chart
The statistical analysis conducted on geographies consisting of 76,205,859 people shows a mild positive correlation between the proportion of Cree and poverty level among females in the United States with a correlation coefficient (R) of 0.306 and weighted average of 15.1%. Similarly, the statistical analysis conducted on geographies consisting of 43,449,399 people shows a poor negative correlation between the proportion of Soviet Union and poverty level among females in the United States with a correlation coefficient (R) of -0.106 and weighted average of 12.6%, a difference of 19.2%.
Female Poverty Correlation Summary
| Measurement | Cree | Soviet Union |
| Minimum | 1.9% | 0.56% |
| Maximum | 46.1% | 26.3% |
| Range | 44.3% | 25.7% |
| Mean | 18.3% | 9.6% |
| Median | 15.5% | 9.2% |
| Interquartile 25% (IQ1) | 13.0% | 5.7% |
| Interquartile 75% (IQ3) | 22.2% | 12.7% |
| Interquartile Range (IQR) | 9.2% | 7.0% |
| Standard Deviation (Sample) | 10.7% | 5.2% |
| Standard Deviation (Population) | 10.6% | 5.1% |
Similar Demographics by Female Poverty
Demographics Similar to Cree by Female Poverty
In terms of female poverty, the demographic groups most similar to Cree are French American Indian (15.1%, a difference of 0.19%), Immigrants from Armenia (15.1%, a difference of 0.26%), Immigrants from Laos (15.0%, a difference of 0.63%), Immigrants from Middle Africa (15.2%, a difference of 0.78%), and Sudanese (15.2%, a difference of 0.84%).
| Demographics | Rating | Rank | Female Poverty |
| Ghanaians | 1.9 /100 | #229 | Tragic 14.7% |
| Alaska Natives | 1.8 /100 | #230 | Tragic 14.7% |
| Nigerians | 1.7 /100 | #231 | Tragic 14.8% |
| Osage | 1.5 /100 | #232 | Tragic 14.8% |
| Immigrants | Saudi Arabia | 1.4 /100 | #233 | Tragic 14.8% |
| Fijians | 1.1 /100 | #234 | Tragic 14.9% |
| Immigrants | Laos | 0.9 /100 | #235 | Tragic 15.0% |
| Cree | 0.7 /100 | #236 | Tragic 15.1% |
| French American Indians | 0.6 /100 | #237 | Tragic 15.1% |
| Immigrants | Armenia | 0.6 /100 | #238 | Tragic 15.1% |
| Immigrants | Middle Africa | 0.5 /100 | #239 | Tragic 15.2% |
| Sudanese | 0.5 /100 | #240 | Tragic 15.2% |
| Immigrants | Sudan | 0.4 /100 | #241 | Tragic 15.2% |
| Nepalese | 0.4 /100 | #242 | Tragic 15.2% |
| Nicaraguans | 0.3 /100 | #243 | Tragic 15.3% |
Demographics Similar to Soviet Union by Female Poverty
In terms of female poverty, the demographic groups most similar to Soviet Union are Immigrants from Israel (12.6%, a difference of 0.14%), Canadian (12.7%, a difference of 0.17%), Paraguayan (12.6%, a difference of 0.22%), Immigrants from Zimbabwe (12.6%, a difference of 0.25%), and Portuguese (12.6%, a difference of 0.27%).
| Demographics | Rating | Rank | Female Poverty |
| Palestinians | 94.3 /100 | #104 | Exceptional 12.5% |
| Scottish | 94.1 /100 | #105 | Exceptional 12.5% |
| Immigrants | Turkey | 93.8 /100 | #106 | Exceptional 12.6% |
| Laotians | 93.4 /100 | #107 | Exceptional 12.6% |
| Portuguese | 93.1 /100 | #108 | Exceptional 12.6% |
| Immigrants | Zimbabwe | 93.1 /100 | #109 | Exceptional 12.6% |
| Paraguayans | 93.0 /100 | #110 | Exceptional 12.6% |
| Soviet Union | 92.4 /100 | #111 | Exceptional 12.6% |
| Immigrants | Israel | 92.0 /100 | #112 | Exceptional 12.6% |
| Canadians | 92.0 /100 | #113 | Exceptional 12.7% |
| Welsh | 91.6 /100 | #114 | Exceptional 12.7% |
| Puget Sound Salish | 91.5 /100 | #115 | Exceptional 12.7% |
| Immigrants | Russia | 91.2 /100 | #116 | Exceptional 12.7% |
| Immigrants | Southern Europe | 90.9 /100 | #117 | Exceptional 12.7% |
| Sri Lankans | 90.9 /100 | #118 | Exceptional 12.7% |