Asian vs Soviet Union No Schooling Completed
COMPARE
Asian
Soviet Union
No Schooling Completed
No Schooling Completed Comparison
Asians
Soviet Union
2.4%
NO SCHOOLING COMPLETED
1.2/ 100
METRIC RATING
248th/ 347
METRIC RANK
2.0%
NO SCHOOLING COMPLETED
77.1/ 100
METRIC RATING
147th/ 347
METRIC RANK
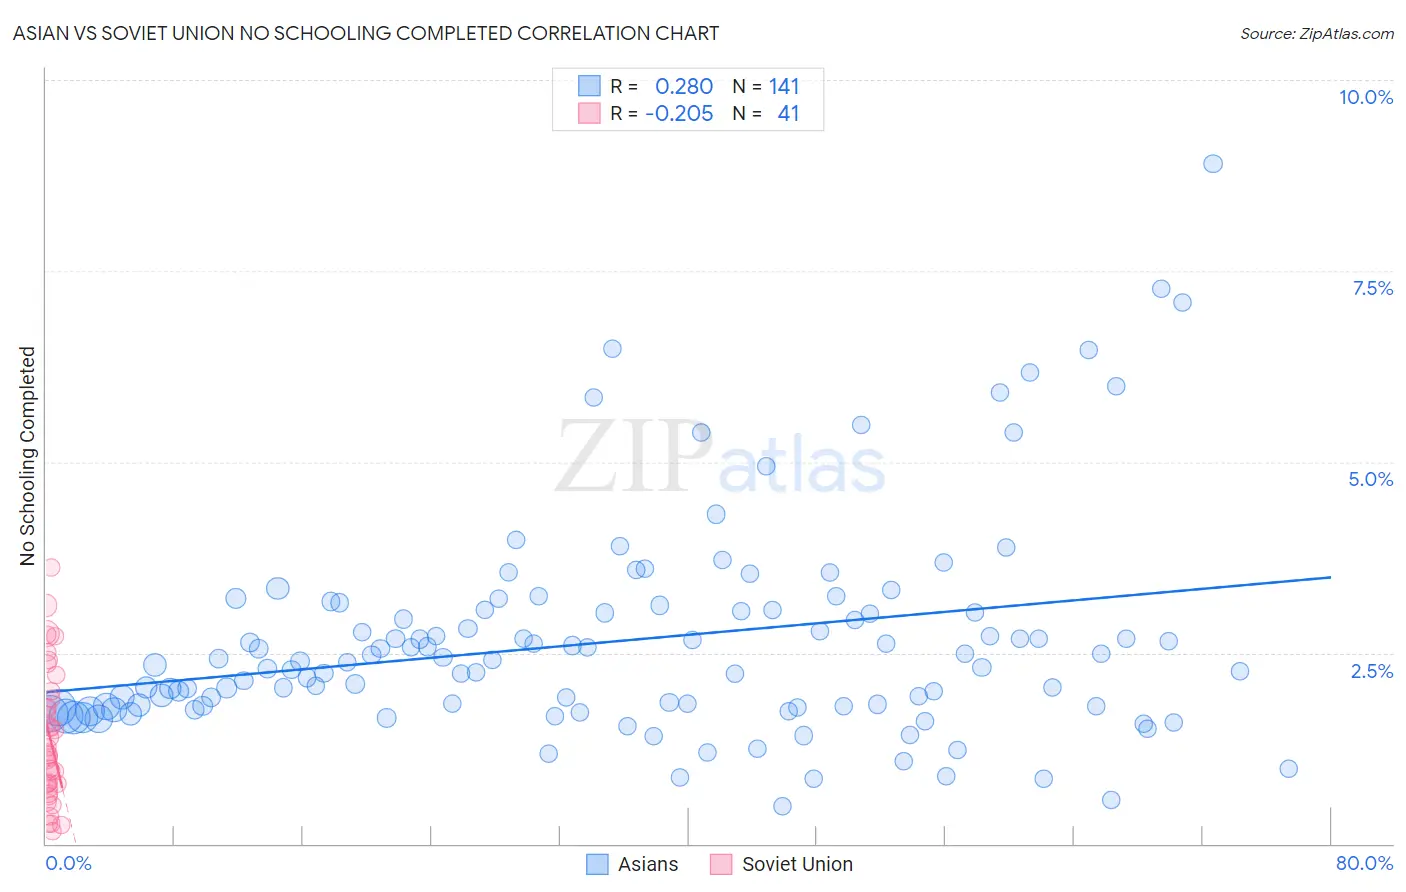
Asian vs Soviet Union No Schooling Completed Correlation Chart
The statistical analysis conducted on geographies consisting of 537,405,383 people shows a weak positive correlation between the proportion of Asians and percentage of population with no schooling in the United States with a correlation coefficient (R) of 0.280 and weighted average of 2.4%. Similarly, the statistical analysis conducted on geographies consisting of 43,404,550 people shows a weak negative correlation between the proportion of Soviet Union and percentage of population with no schooling in the United States with a correlation coefficient (R) of -0.205 and weighted average of 2.0%, a difference of 19.6%.
No Schooling Completed Correlation Summary
| Measurement | Asian | Soviet Union |
| Minimum | 0.49% | 0.17% |
| Maximum | 8.9% | 3.6% |
| Range | 8.4% | 3.4% |
| Mean | 2.7% | 1.4% |
| Median | 2.4% | 1.2% |
| Interquartile 25% (IQ1) | 1.8% | 0.75% |
| Interquartile 75% (IQ3) | 3.1% | 1.9% |
| Interquartile Range (IQR) | 1.3% | 1.2% |
| Standard Deviation (Sample) | 1.4% | 0.87% |
| Standard Deviation (Population) | 1.4% | 0.86% |
Similar Demographics by No Schooling Completed
Demographics Similar to Asians by No Schooling Completed
In terms of no schooling completed, the demographic groups most similar to Asians are Jamaican (2.4%, a difference of 0.19%), Immigrants from Middle Africa (2.4%, a difference of 0.24%), Immigrants from Africa (2.4%, a difference of 0.25%), Immigrants from Iraq (2.4%, a difference of 0.27%), and Immigrants from Congo (2.4%, a difference of 0.37%).
| Demographics | Rating | Rank | No Schooling Completed |
| Koreans | 1.7 /100 | #241 | Tragic 2.4% |
| Immigrants | Indonesia | 1.5 /100 | #242 | Tragic 2.4% |
| South Americans | 1.5 /100 | #243 | Tragic 2.4% |
| Peruvians | 1.4 /100 | #244 | Tragic 2.4% |
| Bolivians | 1.4 /100 | #245 | Tragic 2.4% |
| Immigrants | Congo | 1.4 /100 | #246 | Tragic 2.4% |
| Immigrants | Iraq | 1.3 /100 | #247 | Tragic 2.4% |
| Asians | 1.2 /100 | #248 | Tragic 2.4% |
| Jamaicans | 1.2 /100 | #249 | Tragic 2.4% |
| Immigrants | Middle Africa | 1.1 /100 | #250 | Tragic 2.4% |
| Immigrants | Africa | 1.1 /100 | #251 | Tragic 2.4% |
| Immigrants | Colombia | 1.0 /100 | #252 | Tragic 2.4% |
| Immigrants | Asia | 0.9 /100 | #253 | Tragic 2.4% |
| Immigrants | Eastern Africa | 0.9 /100 | #254 | Tragic 2.4% |
| Ethiopians | 0.8 /100 | #255 | Tragic 2.4% |
Demographics Similar to Soviet Union by No Schooling Completed
In terms of no schooling completed, the demographic groups most similar to Soviet Union are Shoshone (2.0%, a difference of 0.080%), Immigrants from Moldova (2.0%, a difference of 0.17%), Immigrants from North Macedonia (2.0%, a difference of 0.24%), Immigrants from Iran (2.0%, a difference of 0.39%), and Alsatian (2.0%, a difference of 0.40%).
| Demographics | Rating | Rank | No Schooling Completed |
| Marshallese | 83.5 /100 | #140 | Excellent 2.0% |
| Immigrants | Greece | 83.5 /100 | #141 | Excellent 2.0% |
| Venezuelans | 81.5 /100 | #142 | Excellent 2.0% |
| Immigrants | South Central Asia | 80.0 /100 | #143 | Good 2.0% |
| Alsatians | 79.1 /100 | #144 | Good 2.0% |
| Immigrants | Iran | 79.0 /100 | #145 | Good 2.0% |
| Immigrants | Moldova | 78.0 /100 | #146 | Good 2.0% |
| Soviet Union | 77.1 /100 | #147 | Good 2.0% |
| Shoshone | 76.7 /100 | #148 | Good 2.0% |
| Immigrants | North Macedonia | 75.9 /100 | #149 | Good 2.0% |
| Blackfeet | 72.9 /100 | #150 | Good 2.0% |
| Immigrants | Jordan | 70.9 /100 | #151 | Good 2.0% |
| Immigrants | Eastern Europe | 70.4 /100 | #152 | Good 2.0% |
| Immigrants | Italy | 68.9 /100 | #153 | Good 2.0% |
| Immigrants | Venezuela | 68.5 /100 | #154 | Good 2.0% |