Mongolian vs Pennsylvania German Single Female Poverty
COMPARE
Mongolian
Pennsylvania German
Single Female Poverty
Single Female Poverty Comparison
Mongolians
Pennsylvania Germans
20.2%
SINGLE FEMALE POVERTY
93.2/ 100
METRIC RATING
127th/ 347
METRIC RANK
23.6%
SINGLE FEMALE POVERTY
0.0/ 100
METRIC RATING
277th/ 347
METRIC RANK
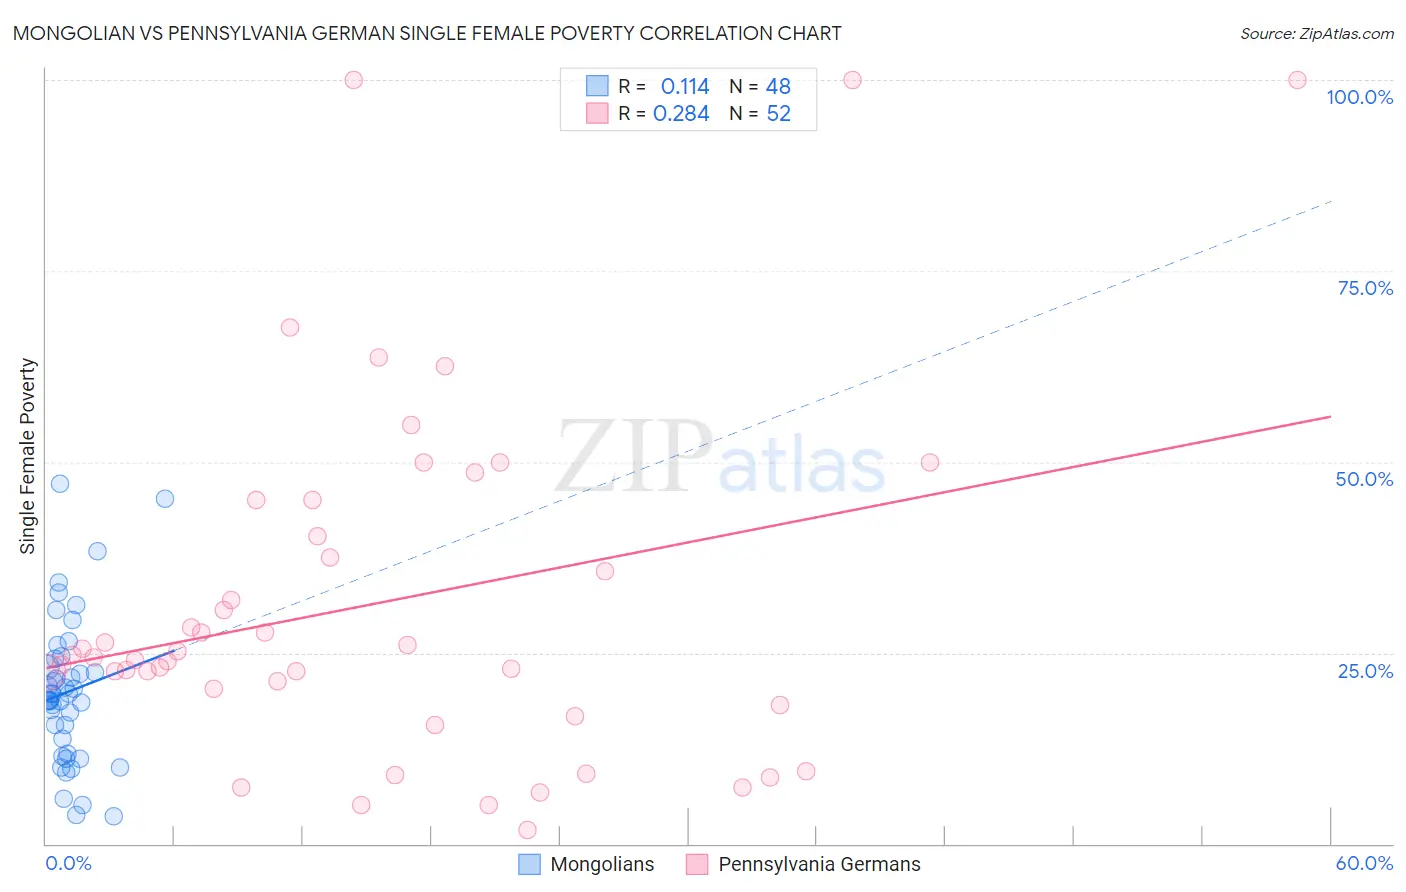
Mongolian vs Pennsylvania German Single Female Poverty Correlation Chart
The statistical analysis conducted on geographies consisting of 139,671,707 people shows a poor positive correlation between the proportion of Mongolians and poverty level among single females in the United States with a correlation coefficient (R) of 0.114 and weighted average of 20.2%. Similarly, the statistical analysis conducted on geographies consisting of 231,066,228 people shows a weak positive correlation between the proportion of Pennsylvania Germans and poverty level among single females in the United States with a correlation coefficient (R) of 0.284 and weighted average of 23.6%, a difference of 17.0%.
Single Female Poverty Correlation Summary
| Measurement | Mongolian | Pennsylvania German |
| Minimum | 3.5% | 1.8% |
| Maximum | 47.1% | 100.0% |
| Range | 43.6% | 98.2% |
| Mean | 19.9% | 31.6% |
| Median | 19.2% | 24.5% |
| Interquartile 25% (IQ1) | 12.8% | 19.2% |
| Interquartile 75% (IQ3) | 23.7% | 42.6% |
| Interquartile Range (IQR) | 10.9% | 23.4% |
| Standard Deviation (Sample) | 9.6% | 23.3% |
| Standard Deviation (Population) | 9.5% | 23.1% |
Similar Demographics by Single Female Poverty
Demographics Similar to Mongolians by Single Female Poverty
In terms of single female poverty, the demographic groups most similar to Mongolians are Serbian (20.1%, a difference of 0.020%), Immigrants from Spain (20.2%, a difference of 0.11%), Immigrants from South Africa (20.1%, a difference of 0.19%), Immigrants from Morocco (20.2%, a difference of 0.19%), and Immigrants from Hungary (20.2%, a difference of 0.21%).
| Demographics | Rating | Rank | Single Female Poverty |
| South Americans | 95.1 /100 | #120 | Exceptional 20.0% |
| Immigrants | Switzerland | 95.1 /100 | #121 | Exceptional 20.0% |
| Immigrants | South America | 95.0 /100 | #122 | Exceptional 20.0% |
| Brazilians | 94.4 /100 | #123 | Exceptional 20.1% |
| Immigrants | Chile | 94.3 /100 | #124 | Exceptional 20.1% |
| Immigrants | South Africa | 93.9 /100 | #125 | Exceptional 20.1% |
| Serbians | 93.3 /100 | #126 | Exceptional 20.1% |
| Mongolians | 93.2 /100 | #127 | Exceptional 20.2% |
| Immigrants | Spain | 92.7 /100 | #128 | Exceptional 20.2% |
| Immigrants | Morocco | 92.4 /100 | #129 | Exceptional 20.2% |
| Immigrants | Hungary | 92.3 /100 | #130 | Exceptional 20.2% |
| Pakistanis | 92.1 /100 | #131 | Exceptional 20.2% |
| Uruguayans | 92.1 /100 | #132 | Exceptional 20.2% |
| Immigrants | England | 91.9 /100 | #133 | Exceptional 20.2% |
| Immigrants | Venezuela | 91.5 /100 | #134 | Exceptional 20.2% |
Demographics Similar to Pennsylvania Germans by Single Female Poverty
In terms of single female poverty, the demographic groups most similar to Pennsylvania Germans are Nonimmigrants (23.6%, a difference of 0.080%), Alaskan Athabascan (23.6%, a difference of 0.11%), Immigrants from the Azores (23.5%, a difference of 0.15%), Immigrants from Latin America (23.7%, a difference of 0.60%), and Mexican American Indian (23.4%, a difference of 0.94%).
| Demographics | Rating | Rank | Single Female Poverty |
| Inupiat | 0.2 /100 | #270 | Tragic 23.1% |
| Sub-Saharan Africans | 0.1 /100 | #271 | Tragic 23.2% |
| Immigrants | Senegal | 0.1 /100 | #272 | Tragic 23.2% |
| Alaska Natives | 0.1 /100 | #273 | Tragic 23.3% |
| Marshallese | 0.1 /100 | #274 | Tragic 23.3% |
| Mexican American Indians | 0.1 /100 | #275 | Tragic 23.4% |
| Immigrants | Azores | 0.0 /100 | #276 | Tragic 23.5% |
| Pennsylvania Germans | 0.0 /100 | #277 | Tragic 23.6% |
| Immigrants | Nonimmigrants | 0.0 /100 | #278 | Tragic 23.6% |
| Alaskan Athabascans | 0.0 /100 | #279 | Tragic 23.6% |
| Immigrants | Latin America | 0.0 /100 | #280 | Tragic 23.7% |
| Immigrants | Zaire | 0.0 /100 | #281 | Tragic 23.8% |
| Guatemalans | 0.0 /100 | #282 | Tragic 23.8% |
| German Russians | 0.0 /100 | #283 | Tragic 23.9% |
| Immigrants | Dominica | 0.0 /100 | #284 | Tragic 23.9% |