Asian vs Pennsylvania German Associate's Degree
COMPARE
Asian
Pennsylvania German
Associate's Degree
Associate's Degree Comparison
Asians
Pennsylvania Germans
52.1%
ASSOCIATE'S DEGREE
99.9/ 100
METRIC RATING
50th/ 347
METRIC RANK
37.2%
ASSOCIATE'S DEGREE
0.0/ 100
METRIC RATING
322nd/ 347
METRIC RANK
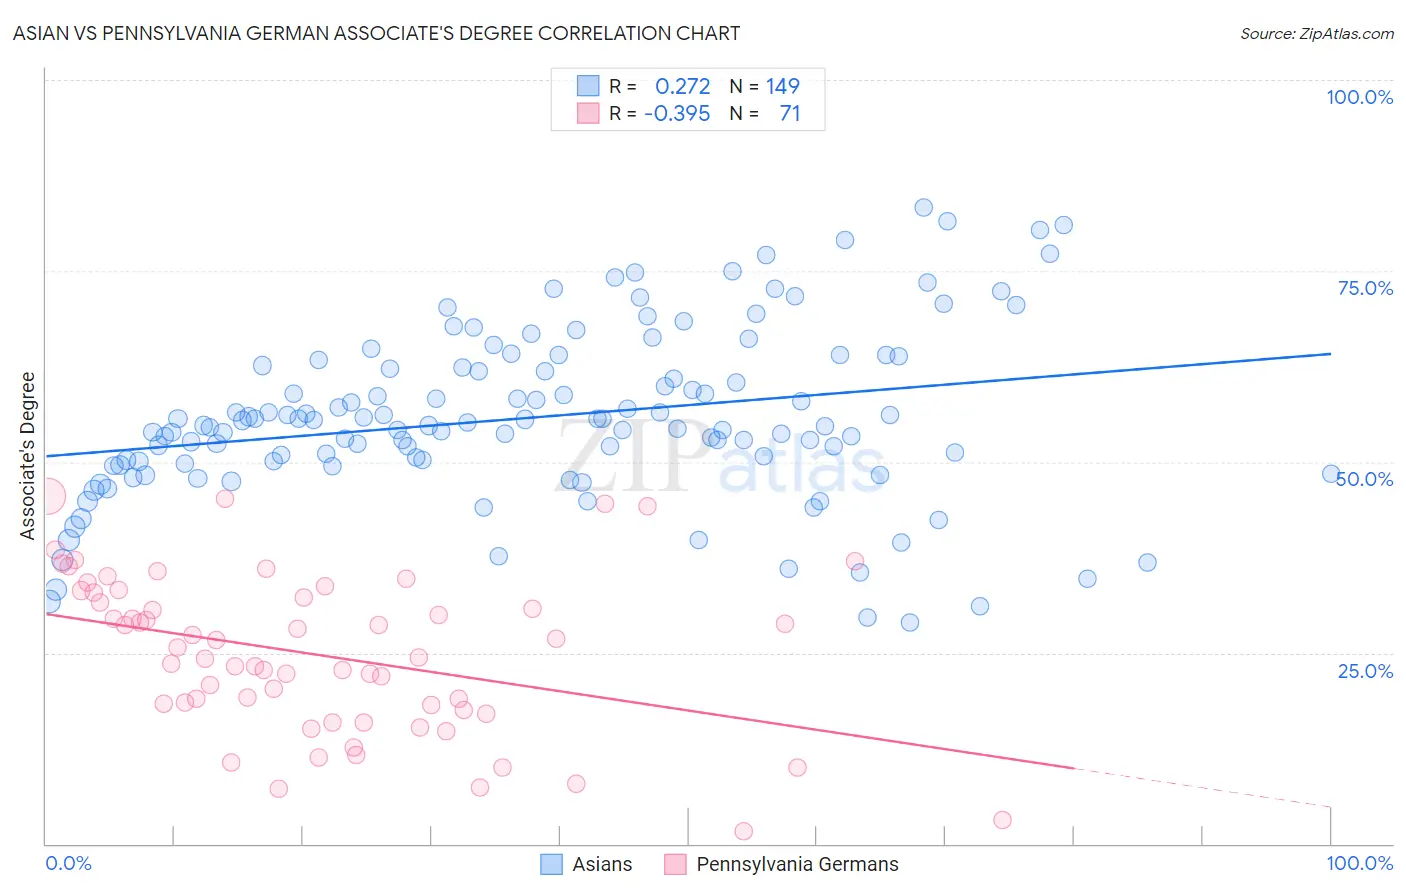
Asian vs Pennsylvania German Associate's Degree Correlation Chart
The statistical analysis conducted on geographies consisting of 550,834,644 people shows a weak positive correlation between the proportion of Asians and percentage of population with at least associate's degree education in the United States with a correlation coefficient (R) of 0.272 and weighted average of 52.1%. Similarly, the statistical analysis conducted on geographies consisting of 234,093,670 people shows a mild negative correlation between the proportion of Pennsylvania Germans and percentage of population with at least associate's degree education in the United States with a correlation coefficient (R) of -0.395 and weighted average of 37.2%, a difference of 40.0%.
Associate's Degree Correlation Summary
| Measurement | Asian | Pennsylvania German |
| Minimum | 29.0% | 1.6% |
| Maximum | 83.3% | 45.5% |
| Range | 54.3% | 44.0% |
| Mean | 55.8% | 24.7% |
| Median | 54.8% | 24.4% |
| Interquartile 25% (IQ1) | 49.9% | 17.5% |
| Interquartile 75% (IQ3) | 62.5% | 32.9% |
| Interquartile Range (IQR) | 12.6% | 15.3% |
| Standard Deviation (Sample) | 11.1% | 10.3% |
| Standard Deviation (Population) | 11.1% | 10.2% |
Similar Demographics by Associate's Degree
Demographics Similar to Asians by Associate's Degree
In terms of associate's degree, the demographic groups most similar to Asians are Immigrants from Austria (52.1%, a difference of 0.010%), Immigrants from Greece (52.1%, a difference of 0.080%), Immigrants from Norway (52.2%, a difference of 0.21%), Bolivian (52.0%, a difference of 0.29%), and Immigrants from Asia (52.0%, a difference of 0.31%).
| Demographics | Rating | Rank | Associate's Degree |
| Immigrants | South Africa | 99.9 /100 | #43 | Exceptional 52.5% |
| Estonians | 99.9 /100 | #44 | Exceptional 52.5% |
| Immigrants | Lithuania | 99.9 /100 | #45 | Exceptional 52.4% |
| Immigrants | Bulgaria | 99.9 /100 | #46 | Exceptional 52.4% |
| Immigrants | Kuwait | 99.9 /100 | #47 | Exceptional 52.4% |
| Immigrants | Norway | 99.9 /100 | #48 | Exceptional 52.2% |
| Immigrants | Austria | 99.9 /100 | #49 | Exceptional 52.1% |
| Asians | 99.9 /100 | #50 | Exceptional 52.1% |
| Immigrants | Greece | 99.9 /100 | #51 | Exceptional 52.1% |
| Bolivians | 99.8 /100 | #52 | Exceptional 52.0% |
| Immigrants | Asia | 99.8 /100 | #53 | Exceptional 52.0% |
| Immigrants | Spain | 99.8 /100 | #54 | Exceptional 51.9% |
| Australians | 99.8 /100 | #55 | Exceptional 51.9% |
| Immigrants | Czechoslovakia | 99.8 /100 | #56 | Exceptional 51.9% |
| Paraguayans | 99.8 /100 | #57 | Exceptional 51.8% |
Demographics Similar to Pennsylvania Germans by Associate's Degree
In terms of associate's degree, the demographic groups most similar to Pennsylvania Germans are Immigrants from Yemen (37.3%, a difference of 0.29%), Cajun (37.4%, a difference of 0.40%), Fijian (37.4%, a difference of 0.43%), Alaska Native (37.5%, a difference of 0.66%), and Yaqui (37.6%, a difference of 0.89%).
| Demographics | Rating | Rank | Associate's Degree |
| Creek | 0.0 /100 | #315 | Tragic 37.6% |
| Crow | 0.0 /100 | #316 | Tragic 37.6% |
| Yaqui | 0.0 /100 | #317 | Tragic 37.6% |
| Alaska Natives | 0.0 /100 | #318 | Tragic 37.5% |
| Fijians | 0.0 /100 | #319 | Tragic 37.4% |
| Cajuns | 0.0 /100 | #320 | Tragic 37.4% |
| Immigrants | Yemen | 0.0 /100 | #321 | Tragic 37.3% |
| Pennsylvania Germans | 0.0 /100 | #322 | Tragic 37.2% |
| Immigrants | Cabo Verde | 0.0 /100 | #323 | Tragic 36.8% |
| Arapaho | 0.0 /100 | #324 | Tragic 36.7% |
| Menominee | 0.0 /100 | #325 | Tragic 36.7% |
| Kiowa | 0.0 /100 | #326 | Tragic 36.5% |
| Dutch West Indians | 0.0 /100 | #327 | Tragic 36.5% |
| Alaskan Athabascans | 0.0 /100 | #328 | Tragic 36.5% |
| Paiute | 0.0 /100 | #329 | Tragic 36.4% |