Asian vs Pennsylvania German Median Family Income
COMPARE
Asian
Pennsylvania German
Median Family Income
Median Family Income Comparison
Asians
Pennsylvania Germans
$119,955
MEDIAN FAMILY INCOME
100.0/ 100
METRIC RATING
32nd/ 347
METRIC RANK
$91,763
MEDIAN FAMILY INCOME
0.4/ 100
METRIC RATING
260th/ 347
METRIC RANK
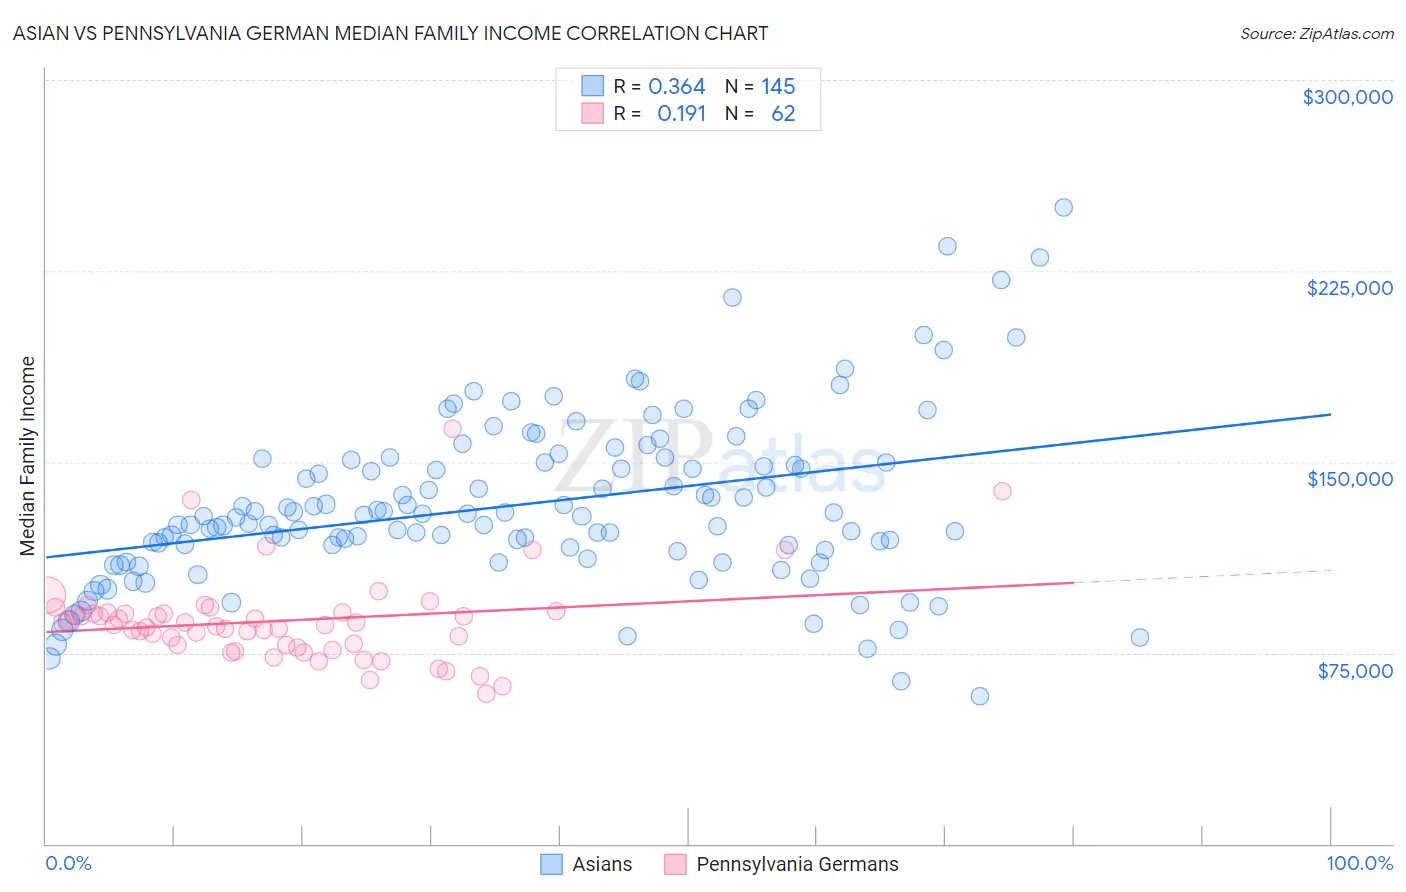
Asian vs Pennsylvania German Median Family Income Correlation Chart
The statistical analysis conducted on geographies consisting of 549,758,807 people shows a mild positive correlation between the proportion of Asians and median family income in the United States with a correlation coefficient (R) of 0.364 and weighted average of $119,955. Similarly, the statistical analysis conducted on geographies consisting of 234,014,323 people shows a poor positive correlation between the proportion of Pennsylvania Germans and median family income in the United States with a correlation coefficient (R) of 0.191 and weighted average of $91,763, a difference of 30.7%.
Median Family Income Correlation Summary
| Measurement | Asian | Pennsylvania German |
| Minimum | $58,163 | $58,875 |
| Maximum | $250,001 | $162,917 |
| Range | $191,838 | $104,042 |
| Mean | $133,077 | $87,564 |
| Median | $128,500 | $85,824 |
| Interquartile 25% (IQ1) | $115,250 | $78,127 |
| Interquartile 75% (IQ3) | $150,323 | $90,788 |
| Interquartile Range (IQR) | $35,073 | $12,661 |
| Standard Deviation (Sample) | $33,384 | $17,527 |
| Standard Deviation (Population) | $33,269 | $17,385 |
Similar Demographics by Median Family Income
Demographics Similar to Asians by Median Family Income
In terms of median family income, the demographic groups most similar to Asians are Immigrants from France ($120,076, a difference of 0.10%), Bhutanese ($119,800, a difference of 0.13%), Immigrants from Sri Lanka ($120,263, a difference of 0.26%), Latvian ($120,301, a difference of 0.29%), and Bolivian ($119,479, a difference of 0.40%).
| Demographics | Rating | Rank | Median Family Income |
| Turks | 100.0 /100 | #25 | Exceptional $121,202 |
| Immigrants | Switzerland | 100.0 /100 | #26 | Exceptional $120,726 |
| Russians | 100.0 /100 | #27 | Exceptional $120,487 |
| Immigrants | Denmark | 100.0 /100 | #28 | Exceptional $120,445 |
| Latvians | 100.0 /100 | #29 | Exceptional $120,301 |
| Immigrants | Sri Lanka | 100.0 /100 | #30 | Exceptional $120,263 |
| Immigrants | France | 100.0 /100 | #31 | Exceptional $120,076 |
| Asians | 100.0 /100 | #32 | Exceptional $119,955 |
| Bhutanese | 100.0 /100 | #33 | Exceptional $119,800 |
| Bolivians | 100.0 /100 | #34 | Exceptional $119,479 |
| Soviet Union | 100.0 /100 | #35 | Exceptional $119,262 |
| Israelis | 100.0 /100 | #36 | Exceptional $118,577 |
| Australians | 100.0 /100 | #37 | Exceptional $118,440 |
| Immigrants | Turkey | 100.0 /100 | #38 | Exceptional $118,325 |
| Immigrants | Asia | 100.0 /100 | #39 | Exceptional $118,291 |
Demographics Similar to Pennsylvania Germans by Median Family Income
In terms of median family income, the demographic groups most similar to Pennsylvania Germans are Inupiat ($91,730, a difference of 0.040%), Liberian ($91,722, a difference of 0.040%), Cape Verdean ($91,848, a difference of 0.090%), Osage ($91,926, a difference of 0.18%), and Immigrants from West Indies ($91,588, a difference of 0.19%).
| Demographics | Rating | Rank | Median Family Income |
| Immigrants | Guyana | 0.6 /100 | #253 | Tragic $92,513 |
| Immigrants | Barbados | 0.5 /100 | #254 | Tragic $92,419 |
| Immigrants | Laos | 0.5 /100 | #255 | Tragic $92,239 |
| Nicaraguans | 0.5 /100 | #256 | Tragic $92,231 |
| Americans | 0.4 /100 | #257 | Tragic $92,096 |
| Osage | 0.4 /100 | #258 | Tragic $91,926 |
| Cape Verdeans | 0.4 /100 | #259 | Tragic $91,848 |
| Pennsylvania Germans | 0.4 /100 | #260 | Tragic $91,763 |
| Inupiat | 0.4 /100 | #261 | Tragic $91,730 |
| Liberians | 0.4 /100 | #262 | Tragic $91,722 |
| Immigrants | West Indies | 0.3 /100 | #263 | Tragic $91,588 |
| Senegalese | 0.3 /100 | #264 | Tragic $91,475 |
| Hmong | 0.3 /100 | #265 | Tragic $91,296 |
| Central Americans | 0.3 /100 | #266 | Tragic $91,087 |
| Mexican American Indians | 0.2 /100 | #267 | Tragic $90,918 |