Asian vs Indonesian Single Mother Poverty
COMPARE
Asian
Indonesian
Single Mother Poverty
Single Mother Poverty Comparison
Asians
Indonesians
26.0%
SINGLE MOTHER POVERTY
100.0/ 100
METRIC RATING
17th/ 347
METRIC RANK
32.4%
SINGLE MOTHER POVERTY
0.0/ 100
METRIC RATING
284th/ 347
METRIC RANK
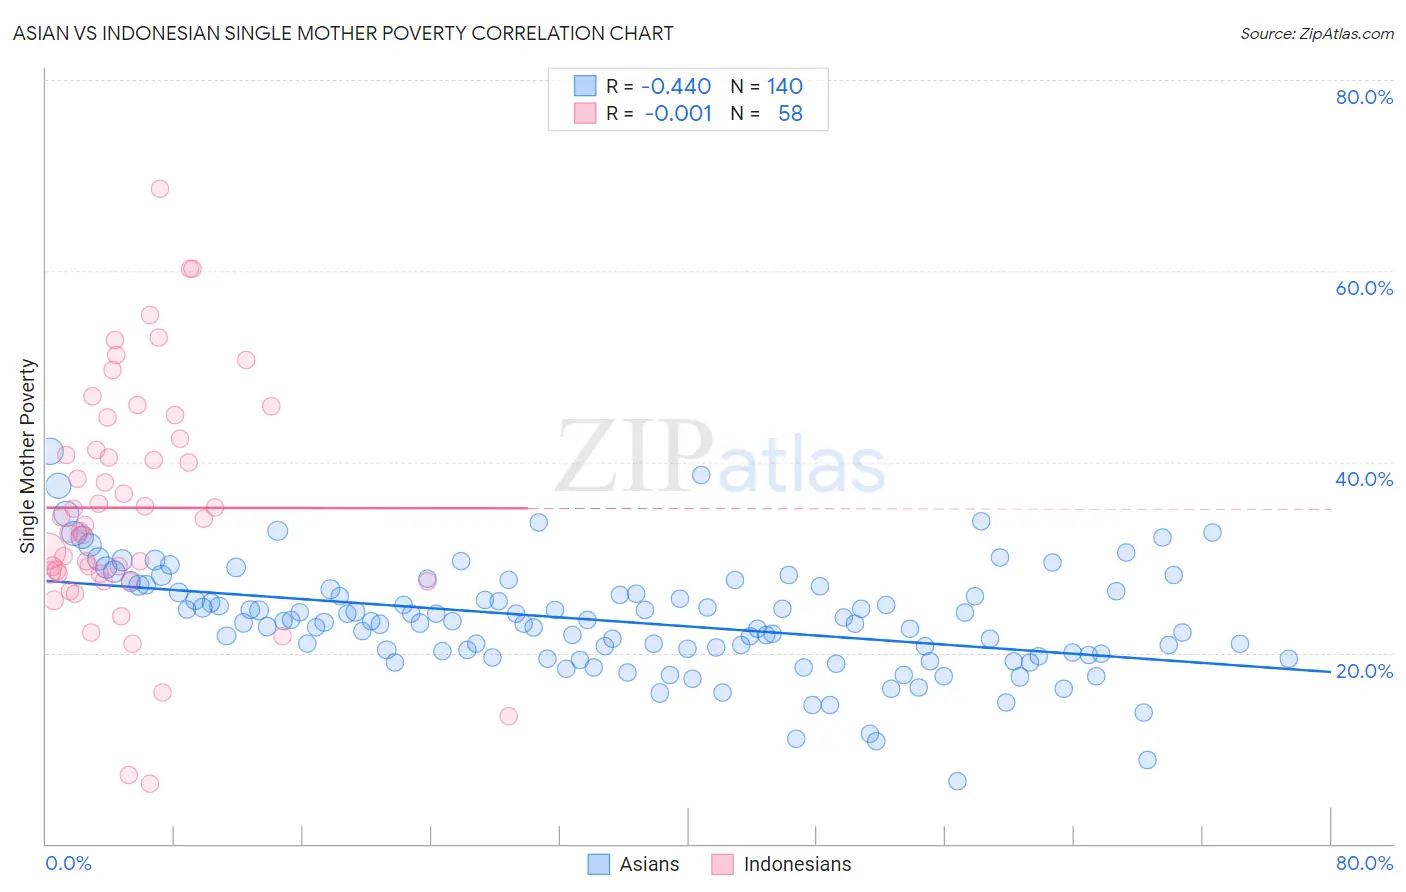
Asian vs Indonesian Single Mother Poverty Correlation Chart
The statistical analysis conducted on geographies consisting of 527,260,509 people shows a moderate negative correlation between the proportion of Asians and poverty level among single mothers in the United States with a correlation coefficient (R) of -0.440 and weighted average of 26.0%. Similarly, the statistical analysis conducted on geographies consisting of 161,147,773 people shows no correlation between the proportion of Indonesians and poverty level among single mothers in the United States with a correlation coefficient (R) of -0.001 and weighted average of 32.4%, a difference of 24.8%.
Single Mother Poverty Correlation Summary
| Measurement | Asian | Indonesian |
| Minimum | 6.6% | 6.2% |
| Maximum | 41.1% | 68.6% |
| Range | 34.6% | 62.4% |
| Mean | 23.3% | 35.2% |
| Median | 23.3% | 33.7% |
| Interquartile 25% (IQ1) | 19.9% | 28.2% |
| Interquartile 75% (IQ3) | 26.4% | 42.4% |
| Interquartile Range (IQR) | 6.5% | 14.2% |
| Standard Deviation (Sample) | 5.6% | 12.5% |
| Standard Deviation (Population) | 5.6% | 12.4% |
Similar Demographics by Single Mother Poverty
Demographics Similar to Asians by Single Mother Poverty
In terms of single mother poverty, the demographic groups most similar to Asians are Bolivian (25.9%, a difference of 0.18%), Immigrants from Pakistan (26.0%, a difference of 0.28%), Immigrants from Eastern Asia (26.1%, a difference of 0.43%), Immigrants from Ireland (25.8%, a difference of 0.47%), and Immigrants from China (26.1%, a difference of 0.55%).
| Demographics | Rating | Rank | Single Mother Poverty |
| Immigrants | South Central Asia | 100.0 /100 | #10 | Exceptional 25.3% |
| Iranians | 100.0 /100 | #11 | Exceptional 25.5% |
| Bhutanese | 100.0 /100 | #12 | Exceptional 25.6% |
| Indians (Asian) | 100.0 /100 | #13 | Exceptional 25.8% |
| Immigrants | Singapore | 100.0 /100 | #14 | Exceptional 25.8% |
| Immigrants | Ireland | 100.0 /100 | #15 | Exceptional 25.8% |
| Bolivians | 100.0 /100 | #16 | Exceptional 25.9% |
| Asians | 100.0 /100 | #17 | Exceptional 26.0% |
| Immigrants | Pakistan | 100.0 /100 | #18 | Exceptional 26.0% |
| Immigrants | Eastern Asia | 100.0 /100 | #19 | Exceptional 26.1% |
| Immigrants | China | 100.0 /100 | #20 | Exceptional 26.1% |
| Immigrants | Bolivia | 100.0 /100 | #21 | Exceptional 26.2% |
| Immigrants | Korea | 100.0 /100 | #22 | Exceptional 26.2% |
| Burmese | 100.0 /100 | #23 | Exceptional 26.2% |
| Immigrants | Moldova | 100.0 /100 | #24 | Exceptional 26.2% |
Demographics Similar to Indonesians by Single Mother Poverty
In terms of single mother poverty, the demographic groups most similar to Indonesians are Immigrants from Latin America (32.4%, a difference of 0.11%), Yup'ik (32.5%, a difference of 0.19%), Spanish American (32.3%, a difference of 0.30%), Immigrants from Dominica (32.5%, a difference of 0.31%), and Somali (32.6%, a difference of 0.54%).
| Demographics | Rating | Rank | Single Mother Poverty |
| Mexican American Indians | 0.0 /100 | #277 | Tragic 31.9% |
| Immigrants | Zaire | 0.0 /100 | #278 | Tragic 32.0% |
| Marshallese | 0.0 /100 | #279 | Tragic 32.1% |
| Immigrants | Nonimmigrants | 0.0 /100 | #280 | Tragic 32.2% |
| Cree | 0.0 /100 | #281 | Tragic 32.2% |
| Immigrants | Azores | 0.0 /100 | #282 | Tragic 32.2% |
| Spanish Americans | 0.0 /100 | #283 | Tragic 32.3% |
| Indonesians | 0.0 /100 | #284 | Tragic 32.4% |
| Immigrants | Latin America | 0.0 /100 | #285 | Tragic 32.4% |
| Yup'ik | 0.0 /100 | #286 | Tragic 32.5% |
| Immigrants | Dominica | 0.0 /100 | #287 | Tragic 32.5% |
| Somalis | 0.0 /100 | #288 | Tragic 32.6% |
| U.S. Virgin Islanders | 0.0 /100 | #289 | Tragic 32.6% |
| Osage | 0.0 /100 | #290 | Tragic 32.6% |
| Guatemalans | 0.0 /100 | #291 | Tragic 32.9% |