Asian vs Hispanic or Latino Single Mother Poverty
COMPARE
Asian
Hispanic or Latino
Single Mother Poverty
Single Mother Poverty Comparison
Asians
Hispanics or Latinos
26.0%
SINGLE MOTHER POVERTY
100.0/ 100
METRIC RATING
17th/ 347
METRIC RANK
33.3%
SINGLE MOTHER POVERTY
0.0/ 100
METRIC RATING
300th/ 347
METRIC RANK
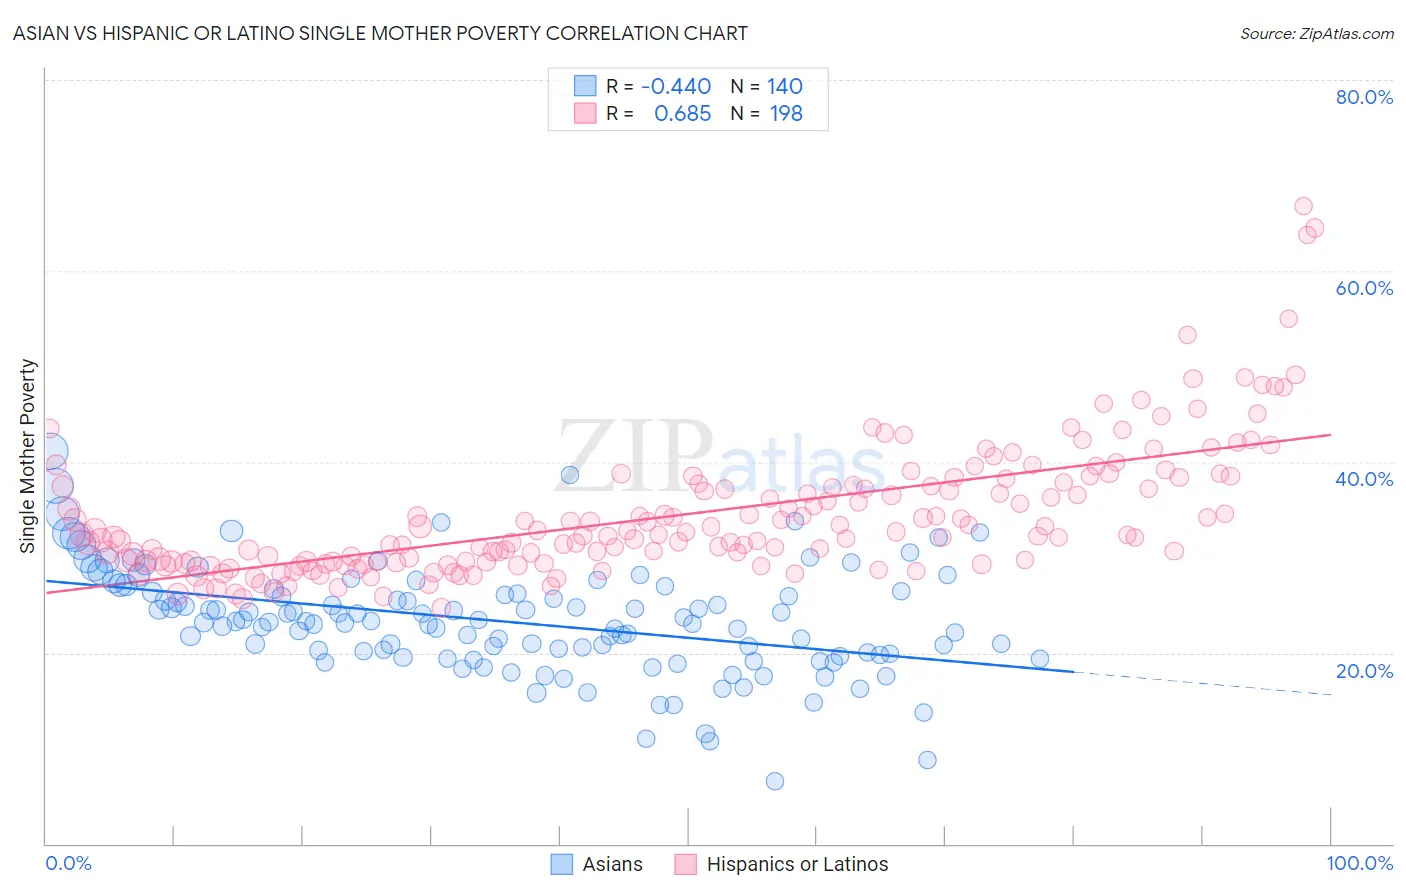
Asian vs Hispanic or Latino Single Mother Poverty Correlation Chart
The statistical analysis conducted on geographies consisting of 527,260,509 people shows a moderate negative correlation between the proportion of Asians and poverty level among single mothers in the United States with a correlation coefficient (R) of -0.440 and weighted average of 26.0%. Similarly, the statistical analysis conducted on geographies consisting of 546,739,929 people shows a significant positive correlation between the proportion of Hispanics or Latinos and poverty level among single mothers in the United States with a correlation coefficient (R) of 0.685 and weighted average of 33.3%, a difference of 28.3%.
Single Mother Poverty Correlation Summary
| Measurement | Asian | Hispanic or Latino |
| Minimum | 6.6% | 24.8% |
| Maximum | 41.1% | 66.8% |
| Range | 34.6% | 42.0% |
| Mean | 23.3% | 34.5% |
| Median | 23.3% | 32.3% |
| Interquartile 25% (IQ1) | 19.9% | 29.6% |
| Interquartile 75% (IQ3) | 26.4% | 37.5% |
| Interquartile Range (IQR) | 6.5% | 8.0% |
| Standard Deviation (Sample) | 5.6% | 6.9% |
| Standard Deviation (Population) | 5.6% | 6.9% |
Similar Demographics by Single Mother Poverty
Demographics Similar to Asians by Single Mother Poverty
In terms of single mother poverty, the demographic groups most similar to Asians are Bolivian (25.9%, a difference of 0.18%), Immigrants from Pakistan (26.0%, a difference of 0.28%), Immigrants from Eastern Asia (26.1%, a difference of 0.43%), Immigrants from Ireland (25.8%, a difference of 0.47%), and Immigrants from China (26.1%, a difference of 0.55%).
| Demographics | Rating | Rank | Single Mother Poverty |
| Immigrants | South Central Asia | 100.0 /100 | #10 | Exceptional 25.3% |
| Iranians | 100.0 /100 | #11 | Exceptional 25.5% |
| Bhutanese | 100.0 /100 | #12 | Exceptional 25.6% |
| Indians (Asian) | 100.0 /100 | #13 | Exceptional 25.8% |
| Immigrants | Singapore | 100.0 /100 | #14 | Exceptional 25.8% |
| Immigrants | Ireland | 100.0 /100 | #15 | Exceptional 25.8% |
| Bolivians | 100.0 /100 | #16 | Exceptional 25.9% |
| Asians | 100.0 /100 | #17 | Exceptional 26.0% |
| Immigrants | Pakistan | 100.0 /100 | #18 | Exceptional 26.0% |
| Immigrants | Eastern Asia | 100.0 /100 | #19 | Exceptional 26.1% |
| Immigrants | China | 100.0 /100 | #20 | Exceptional 26.1% |
| Immigrants | Bolivia | 100.0 /100 | #21 | Exceptional 26.2% |
| Immigrants | Korea | 100.0 /100 | #22 | Exceptional 26.2% |
| Burmese | 100.0 /100 | #23 | Exceptional 26.2% |
| Immigrants | Moldova | 100.0 /100 | #24 | Exceptional 26.2% |
Demographics Similar to Hispanics or Latinos by Single Mother Poverty
In terms of single mother poverty, the demographic groups most similar to Hispanics or Latinos are Immigrants from Guatemala (33.3%, a difference of 0.0%), African (33.3%, a difference of 0.090%), Pennsylvania German (33.2%, a difference of 0.20%), Immigrants from Somalia (33.4%, a difference of 0.24%), and Blackfeet (33.2%, a difference of 0.34%).
| Demographics | Rating | Rank | Single Mother Poverty |
| Aleuts | 0.0 /100 | #293 | Tragic 32.9% |
| French American Indians | 0.0 /100 | #294 | Tragic 33.1% |
| Yaqui | 0.0 /100 | #295 | Tragic 33.1% |
| Blackfeet | 0.0 /100 | #296 | Tragic 33.2% |
| Pennsylvania Germans | 0.0 /100 | #297 | Tragic 33.2% |
| Africans | 0.0 /100 | #298 | Tragic 33.3% |
| Immigrants | Guatemala | 0.0 /100 | #299 | Tragic 33.3% |
| Hispanics or Latinos | 0.0 /100 | #300 | Tragic 33.3% |
| Immigrants | Somalia | 0.0 /100 | #301 | Tragic 33.4% |
| Arapaho | 0.0 /100 | #302 | Tragic 33.4% |
| Americans | 0.0 /100 | #303 | Tragic 33.5% |
| Mexicans | 0.0 /100 | #304 | Tragic 33.6% |
| Immigrants | Central America | 0.0 /100 | #305 | Tragic 33.6% |
| Immigrants | Congo | 0.0 /100 | #306 | Tragic 33.8% |
| Comanche | 0.0 /100 | #307 | Tragic 33.9% |