Asian vs Macedonian Single Mother Poverty
COMPARE
Asian
Macedonian
Single Mother Poverty
Single Mother Poverty Comparison
Asians
Macedonians
26.0%
SINGLE MOTHER POVERTY
100.0/ 100
METRIC RATING
17th/ 347
METRIC RANK
27.4%
SINGLE MOTHER POVERTY
99.4/ 100
METRIC RATING
71st/ 347
METRIC RANK
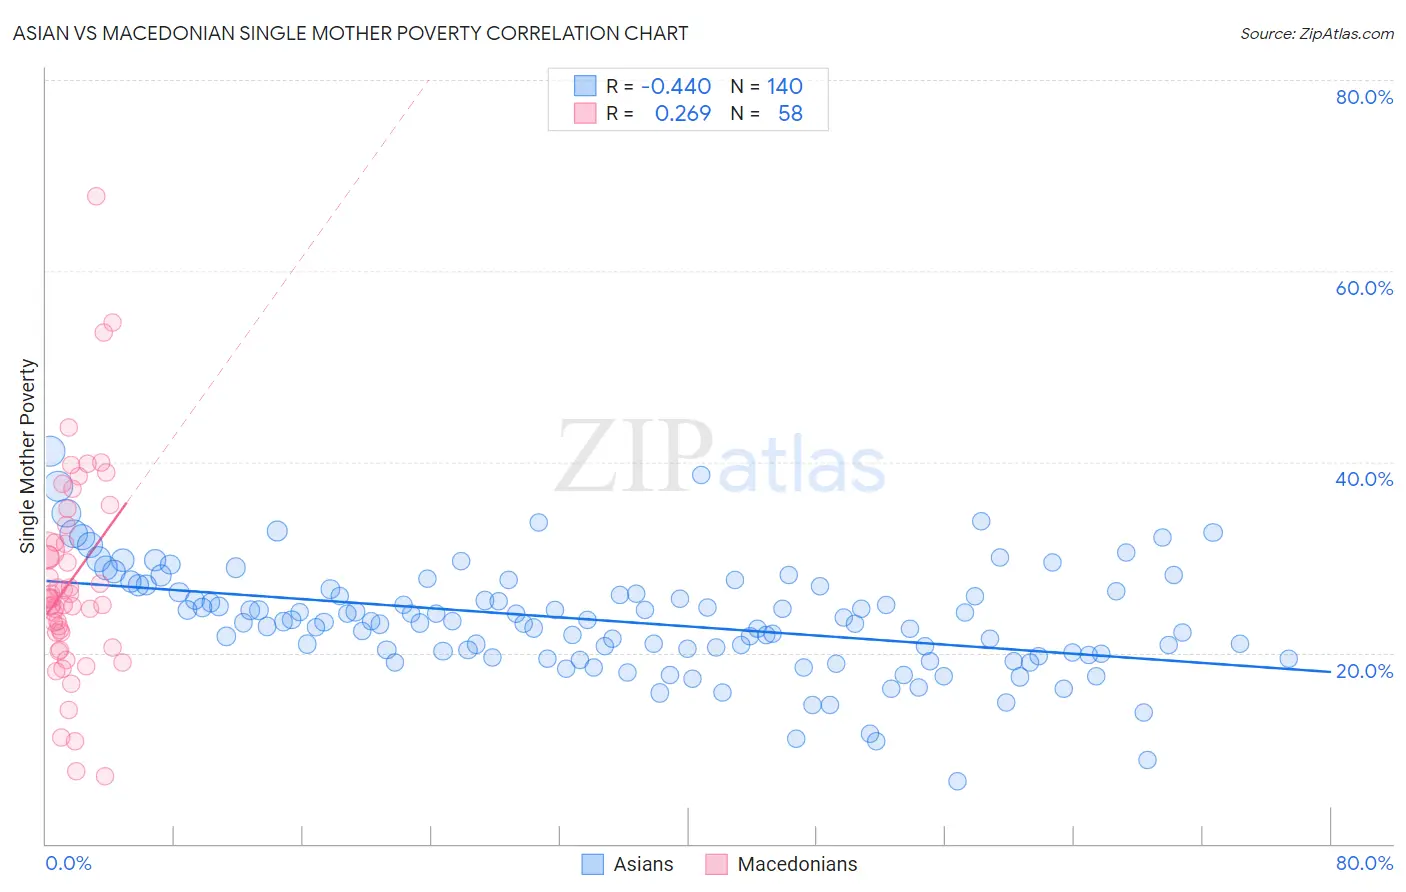
Asian vs Macedonian Single Mother Poverty Correlation Chart
The statistical analysis conducted on geographies consisting of 527,260,509 people shows a moderate negative correlation between the proportion of Asians and poverty level among single mothers in the United States with a correlation coefficient (R) of -0.440 and weighted average of 26.0%. Similarly, the statistical analysis conducted on geographies consisting of 130,650,018 people shows a weak positive correlation between the proportion of Macedonians and poverty level among single mothers in the United States with a correlation coefficient (R) of 0.269 and weighted average of 27.4%, a difference of 5.6%.
Single Mother Poverty Correlation Summary
| Measurement | Asian | Macedonian |
| Minimum | 6.6% | 7.0% |
| Maximum | 41.1% | 67.8% |
| Range | 34.6% | 60.8% |
| Mean | 23.3% | 27.6% |
| Median | 23.3% | 25.7% |
| Interquartile 25% (IQ1) | 19.9% | 22.1% |
| Interquartile 75% (IQ3) | 26.4% | 31.6% |
| Interquartile Range (IQR) | 6.5% | 9.5% |
| Standard Deviation (Sample) | 5.6% | 11.0% |
| Standard Deviation (Population) | 5.6% | 10.9% |
Similar Demographics by Single Mother Poverty
Demographics Similar to Asians by Single Mother Poverty
In terms of single mother poverty, the demographic groups most similar to Asians are Bolivian (25.9%, a difference of 0.18%), Immigrants from Pakistan (26.0%, a difference of 0.28%), Immigrants from Eastern Asia (26.1%, a difference of 0.43%), Immigrants from Ireland (25.8%, a difference of 0.47%), and Immigrants from China (26.1%, a difference of 0.55%).
| Demographics | Rating | Rank | Single Mother Poverty |
| Immigrants | South Central Asia | 100.0 /100 | #10 | Exceptional 25.3% |
| Iranians | 100.0 /100 | #11 | Exceptional 25.5% |
| Bhutanese | 100.0 /100 | #12 | Exceptional 25.6% |
| Indians (Asian) | 100.0 /100 | #13 | Exceptional 25.8% |
| Immigrants | Singapore | 100.0 /100 | #14 | Exceptional 25.8% |
| Immigrants | Ireland | 100.0 /100 | #15 | Exceptional 25.8% |
| Bolivians | 100.0 /100 | #16 | Exceptional 25.9% |
| Asians | 100.0 /100 | #17 | Exceptional 26.0% |
| Immigrants | Pakistan | 100.0 /100 | #18 | Exceptional 26.0% |
| Immigrants | Eastern Asia | 100.0 /100 | #19 | Exceptional 26.1% |
| Immigrants | China | 100.0 /100 | #20 | Exceptional 26.1% |
| Immigrants | Bolivia | 100.0 /100 | #21 | Exceptional 26.2% |
| Immigrants | Korea | 100.0 /100 | #22 | Exceptional 26.2% |
| Burmese | 100.0 /100 | #23 | Exceptional 26.2% |
| Immigrants | Moldova | 100.0 /100 | #24 | Exceptional 26.2% |
Demographics Similar to Macedonians by Single Mother Poverty
In terms of single mother poverty, the demographic groups most similar to Macedonians are Immigrants from Belarus (27.4%, a difference of 0.020%), Immigrants from Russia (27.4%, a difference of 0.020%), Lithuanian (27.4%, a difference of 0.030%), Sierra Leonean (27.4%, a difference of 0.090%), and Immigrants from Europe (27.4%, a difference of 0.15%).
| Demographics | Rating | Rank | Single Mother Poverty |
| Russians | 99.5 /100 | #64 | Exceptional 27.3% |
| Immigrants | Turkey | 99.5 /100 | #65 | Exceptional 27.3% |
| Soviet Union | 99.5 /100 | #66 | Exceptional 27.3% |
| Immigrants | Australia | 99.5 /100 | #67 | Exceptional 27.3% |
| Immigrants | Czechoslovakia | 99.5 /100 | #68 | Exceptional 27.4% |
| Lithuanians | 99.4 /100 | #69 | Exceptional 27.4% |
| Immigrants | Belarus | 99.4 /100 | #70 | Exceptional 27.4% |
| Macedonians | 99.4 /100 | #71 | Exceptional 27.4% |
| Immigrants | Russia | 99.4 /100 | #72 | Exceptional 27.4% |
| Sierra Leoneans | 99.3 /100 | #73 | Exceptional 27.4% |
| Immigrants | Europe | 99.3 /100 | #74 | Exceptional 27.4% |
| Immigrants | Sweden | 99.2 /100 | #75 | Exceptional 27.5% |
| Peruvians | 99.2 /100 | #76 | Exceptional 27.5% |
| Immigrants | Peru | 99.2 /100 | #77 | Exceptional 27.5% |
| Immigrants | North Macedonia | 99.2 /100 | #78 | Exceptional 27.5% |