Armenian vs Kiowa Family Households
COMPARE
Armenian
Kiowa
Family Households
Family Households Comparison
Armenians
Kiowa
64.4%
FAMILY HOUSEHOLDS
55.9/ 100
METRIC RATING
170th/ 347
METRIC RANK
61.4%
FAMILY HOUSEHOLDS
0.0/ 100
METRIC RATING
328th/ 347
METRIC RANK
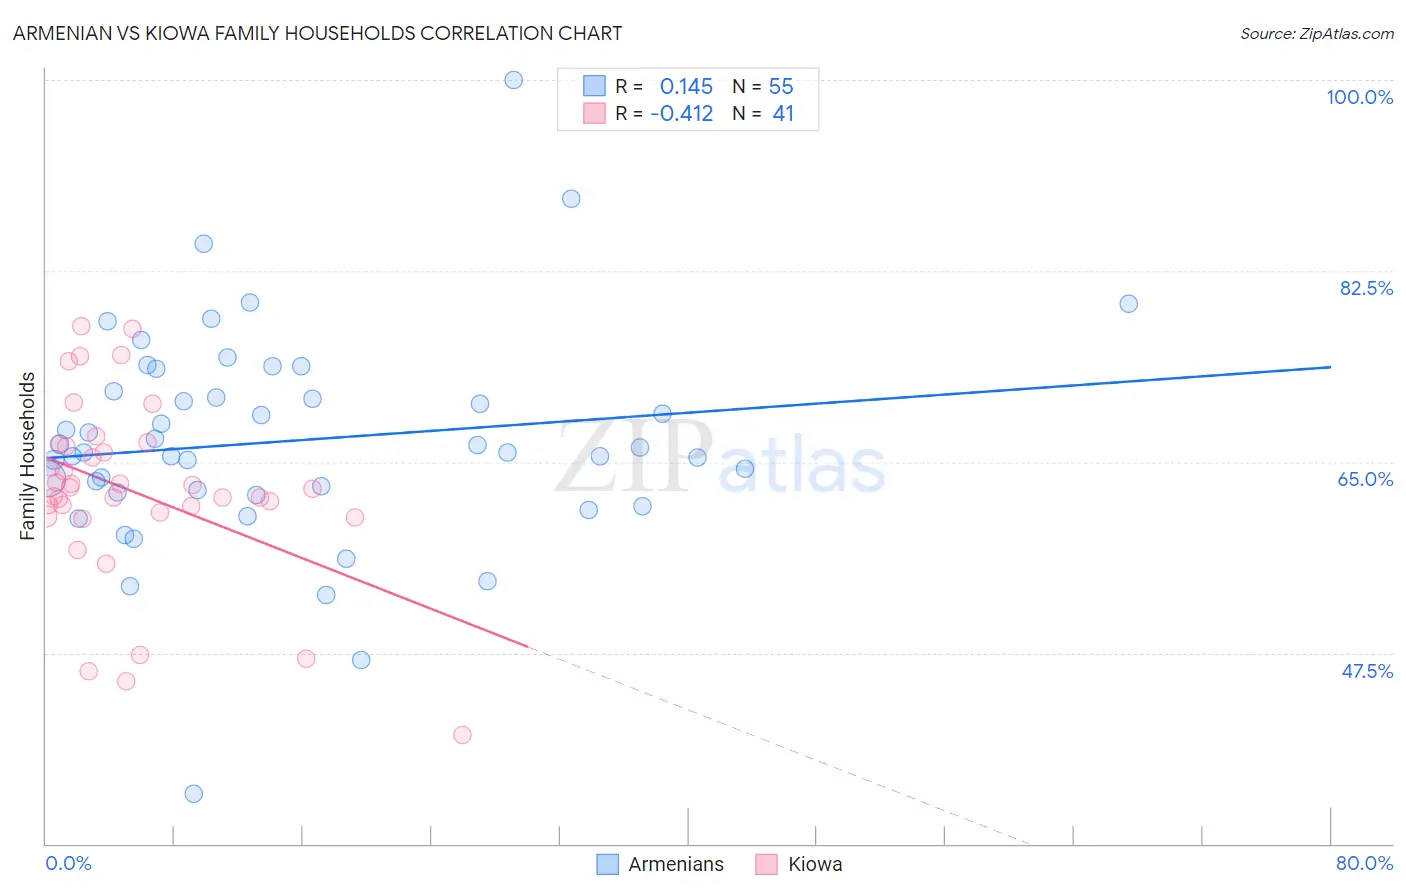
Armenian vs Kiowa Family Households Correlation Chart
The statistical analysis conducted on geographies consisting of 310,784,197 people shows a poor positive correlation between the proportion of Armenians and percentage of family households in the United States with a correlation coefficient (R) of 0.145 and weighted average of 64.4%. Similarly, the statistical analysis conducted on geographies consisting of 56,099,396 people shows a moderate negative correlation between the proportion of Kiowa and percentage of family households in the United States with a correlation coefficient (R) of -0.412 and weighted average of 61.4%, a difference of 4.8%.
Family Households Correlation Summary
| Measurement | Armenian | Kiowa |
| Minimum | 34.5% | 40.0% |
| Maximum | 100.0% | 77.4% |
| Range | 65.5% | 37.4% |
| Mean | 66.9% | 62.3% |
| Median | 65.9% | 62.6% |
| Interquartile 25% (IQ1) | 62.2% | 60.1% |
| Interquartile 75% (IQ3) | 71.4% | 66.6% |
| Interquartile Range (IQR) | 9.3% | 6.4% |
| Standard Deviation (Sample) | 10.1% | 8.3% |
| Standard Deviation (Population) | 10.0% | 8.2% |
Similar Demographics by Family Households
Demographics Similar to Armenians by Family Households
In terms of family households, the demographic groups most similar to Armenians are Iraqi (64.4%, a difference of 0.0%), Honduran (64.4%, a difference of 0.020%), Ute (64.3%, a difference of 0.020%), Irish (64.4%, a difference of 0.030%), and Dutch West Indian (64.3%, a difference of 0.030%).
| Demographics | Rating | Rank | Family Households |
| Chickasaw | 61.5 /100 | #163 | Good 64.4% |
| Immigrants | Nigeria | 60.1 /100 | #164 | Good 64.4% |
| Immigrants | Southern Europe | 60.0 /100 | #165 | Good 64.4% |
| Scotch-Irish | 59.2 /100 | #166 | Average 64.4% |
| Irish | 57.9 /100 | #167 | Average 64.4% |
| Hondurans | 57.5 /100 | #168 | Average 64.4% |
| Iraqis | 56.0 /100 | #169 | Average 64.4% |
| Armenians | 55.9 /100 | #170 | Average 64.4% |
| Ute | 54.6 /100 | #171 | Average 64.3% |
| Dutch West Indians | 53.9 /100 | #172 | Average 64.3% |
| Immigrants | Sierra Leone | 52.5 /100 | #173 | Average 64.3% |
| Immigrants | Germany | 50.0 /100 | #174 | Average 64.3% |
| Bangladeshis | 44.3 /100 | #175 | Average 64.3% |
| Vietnamese | 43.6 /100 | #176 | Average 64.2% |
| Immigrants | Micronesia | 42.3 /100 | #177 | Average 64.2% |
Demographics Similar to Kiowa by Family Households
In terms of family households, the demographic groups most similar to Kiowa are Cambodian (61.4%, a difference of 0.030%), Black/African American (61.5%, a difference of 0.13%), Indonesian (61.5%, a difference of 0.15%), Immigrants from Australia (61.3%, a difference of 0.16%), and Immigrants from France (61.3%, a difference of 0.16%).
| Demographics | Rating | Rank | Family Households |
| Alsatians | 0.0 /100 | #321 | Tragic 61.7% |
| Immigrants | Serbia | 0.0 /100 | #322 | Tragic 61.6% |
| Tlingit-Haida | 0.0 /100 | #323 | Tragic 61.6% |
| Immigrants | West Indies | 0.0 /100 | #324 | Tragic 61.6% |
| Immigrants | Switzerland | 0.0 /100 | #325 | Tragic 61.6% |
| Indonesians | 0.0 /100 | #326 | Tragic 61.5% |
| Blacks/African Americans | 0.0 /100 | #327 | Tragic 61.5% |
| Kiowa | 0.0 /100 | #328 | Tragic 61.4% |
| Cambodians | 0.0 /100 | #329 | Tragic 61.4% |
| Immigrants | Australia | 0.0 /100 | #330 | Tragic 61.3% |
| Immigrants | France | 0.0 /100 | #331 | Tragic 61.3% |
| Ethiopians | 0.0 /100 | #332 | Tragic 61.2% |
| Immigrants | Ethiopia | 0.0 /100 | #333 | Tragic 61.2% |
| Immigrants | Eastern Africa | 0.0 /100 | #334 | Tragic 61.1% |
| Carpatho Rusyns | 0.0 /100 | #335 | Tragic 61.1% |