Arab vs Immigrants from Germany Ambulatory Disability
COMPARE
Arab
Immigrants from Germany
Ambulatory Disability
Ambulatory Disability Comparison
Arabs
Immigrants from Germany
5.9%
AMBULATORY DISABILITY
91.5/ 100
METRIC RATING
126th/ 347
METRIC RANK
6.4%
AMBULATORY DISABILITY
1.8/ 100
METRIC RATING
237th/ 347
METRIC RANK
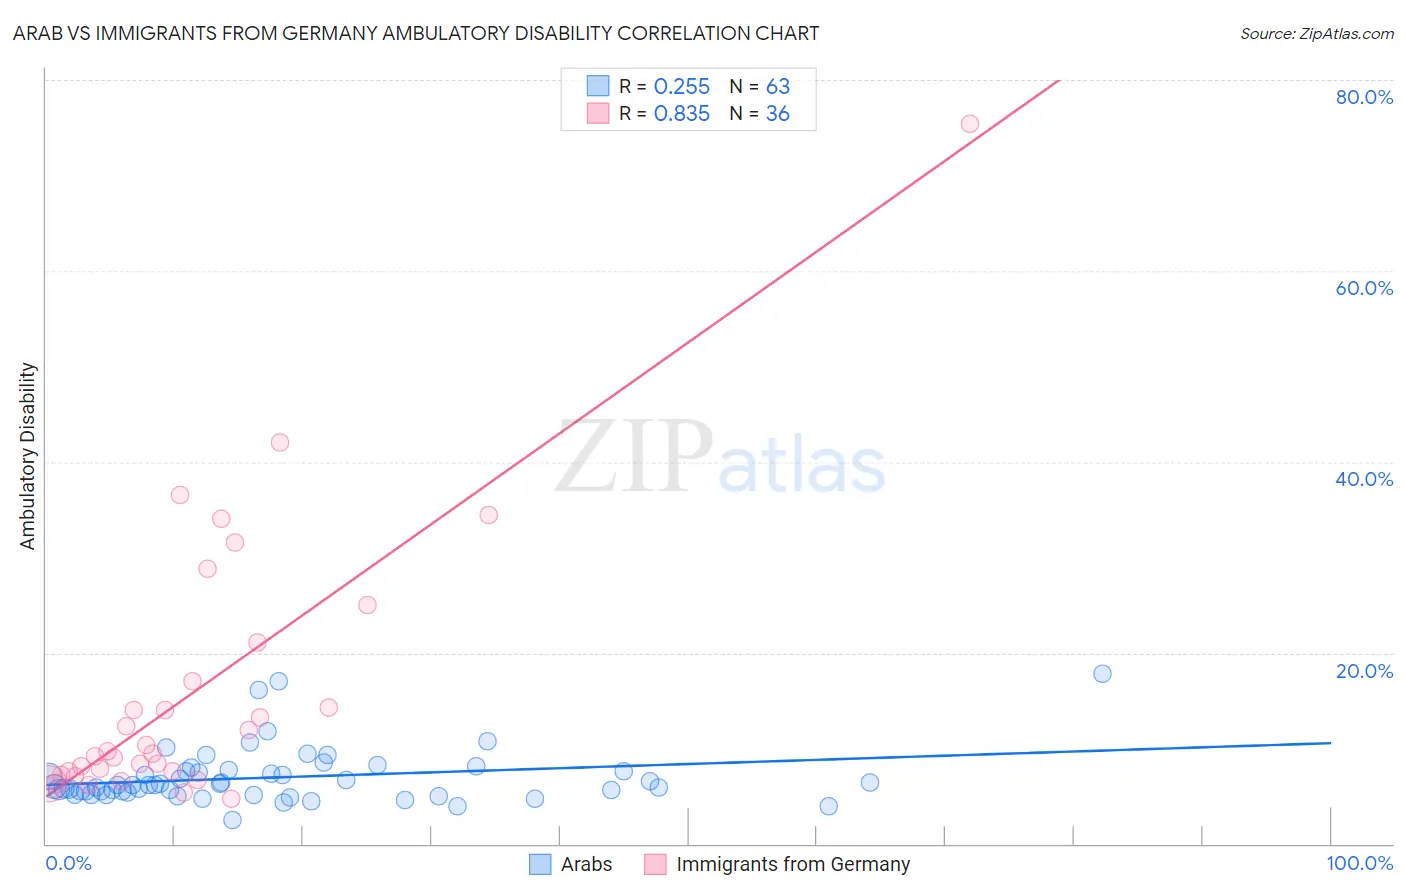
Arab vs Immigrants from Germany Ambulatory Disability Correlation Chart
The statistical analysis conducted on geographies consisting of 486,612,258 people shows a weak positive correlation between the proportion of Arabs and percentage of population with ambulatory disability in the United States with a correlation coefficient (R) of 0.255 and weighted average of 5.9%. Similarly, the statistical analysis conducted on geographies consisting of 463,770,128 people shows a very strong positive correlation between the proportion of Immigrants from Germany and percentage of population with ambulatory disability in the United States with a correlation coefficient (R) of 0.835 and weighted average of 6.4%, a difference of 8.7%.
Ambulatory Disability Correlation Summary
| Measurement | Arab | Immigrants from Germany |
| Minimum | 2.5% | 4.7% |
| Maximum | 17.8% | 75.4% |
| Range | 15.3% | 70.7% |
| Mean | 7.0% | 16.1% |
| Median | 6.2% | 9.6% |
| Interquartile 25% (IQ1) | 5.4% | 7.4% |
| Interquartile 75% (IQ3) | 7.5% | 19.0% |
| Interquartile Range (IQR) | 2.1% | 11.6% |
| Standard Deviation (Sample) | 2.9% | 14.5% |
| Standard Deviation (Population) | 2.8% | 14.3% |
Similar Demographics by Ambulatory Disability
Demographics Similar to Arabs by Ambulatory Disability
In terms of ambulatory disability, the demographic groups most similar to Arabs are Korean (5.9%, a difference of 0.020%), Immigrants from Nigeria (5.9%, a difference of 0.10%), Immigrants from Western Asia (5.9%, a difference of 0.13%), Immigrants from Middle Africa (5.9%, a difference of 0.14%), and Immigrants from Norway (5.9%, a difference of 0.17%).
| Demographics | Rating | Rank | Ambulatory Disability |
| Norwegians | 93.1 /100 | #119 | Exceptional 5.9% |
| Estonians | 92.9 /100 | #120 | Exceptional 5.9% |
| Costa Ricans | 92.6 /100 | #121 | Exceptional 5.9% |
| Icelanders | 92.6 /100 | #122 | Exceptional 5.9% |
| Immigrants | Russia | 92.4 /100 | #123 | Exceptional 5.9% |
| Immigrants | Middle Africa | 92.2 /100 | #124 | Exceptional 5.9% |
| Koreans | 91.6 /100 | #125 | Exceptional 5.9% |
| Arabs | 91.5 /100 | #126 | Exceptional 5.9% |
| Immigrants | Nigeria | 90.9 /100 | #127 | Exceptional 5.9% |
| Immigrants | Western Asia | 90.7 /100 | #128 | Exceptional 5.9% |
| Immigrants | Norway | 90.5 /100 | #129 | Exceptional 5.9% |
| Immigrants | Kazakhstan | 89.7 /100 | #130 | Excellent 5.9% |
| Immigrants | Costa Rica | 89.5 /100 | #131 | Excellent 5.9% |
| Immigrants | Europe | 87.8 /100 | #132 | Excellent 6.0% |
| Immigrants | Immigrants | 86.9 /100 | #133 | Excellent 6.0% |
Demographics Similar to Immigrants from Germany by Ambulatory Disability
In terms of ambulatory disability, the demographic groups most similar to Immigrants from Germany are Haitian (6.4%, a difference of 0.010%), Senegalese (6.4%, a difference of 0.080%), Dutch (6.4%, a difference of 0.090%), Immigrants from Senegal (6.4%, a difference of 0.10%), and Immigrants from Haiti (6.5%, a difference of 0.19%).
| Demographics | Rating | Rank | Ambulatory Disability |
| Mexicans | 3.5 /100 | #230 | Tragic 6.4% |
| Panamanians | 3.1 /100 | #231 | Tragic 6.4% |
| Assyrians/Chaldeans/Syriacs | 2.4 /100 | #232 | Tragic 6.4% |
| Sub-Saharan Africans | 2.3 /100 | #233 | Tragic 6.4% |
| Immigrants | Liberia | 2.3 /100 | #234 | Tragic 6.4% |
| Hispanics or Latinos | 2.2 /100 | #235 | Tragic 6.4% |
| Dutch | 2.0 /100 | #236 | Tragic 6.4% |
| Immigrants | Germany | 1.8 /100 | #237 | Tragic 6.4% |
| Haitians | 1.8 /100 | #238 | Tragic 6.4% |
| Senegalese | 1.7 /100 | #239 | Tragic 6.4% |
| Immigrants | Senegal | 1.7 /100 | #240 | Tragic 6.4% |
| Immigrants | Haiti | 1.6 /100 | #241 | Tragic 6.5% |
| Spaniards | 1.6 /100 | #242 | Tragic 6.5% |
| Germans | 1.5 /100 | #243 | Tragic 6.5% |
| Immigrants | Panama | 1.5 /100 | #244 | Tragic 6.5% |