Arab vs Immigrants from Germany Unemployment
COMPARE
Arab
Immigrants from Germany
Unemployment
Unemployment Comparison
Arabs
Immigrants from Germany
5.3%
UNEMPLOYMENT
35.3/ 100
METRIC RATING
190th/ 347
METRIC RANK
5.1%
UNEMPLOYMENT
90.8/ 100
METRIC RATING
118th/ 347
METRIC RANK
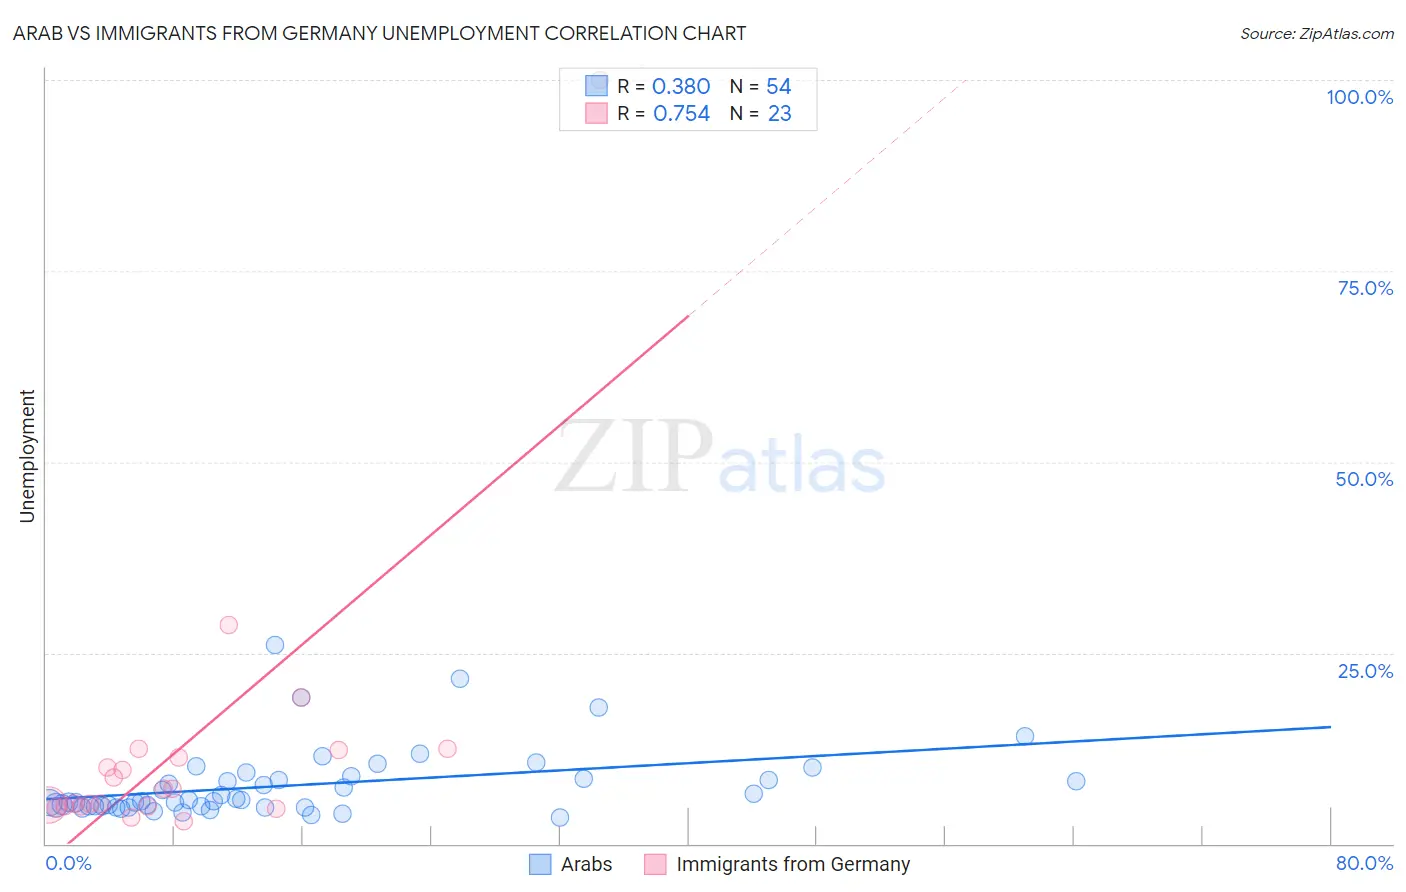
Arab vs Immigrants from Germany Unemployment Correlation Chart
The statistical analysis conducted on geographies consisting of 486,097,556 people shows a mild positive correlation between the proportion of Arabs and unemployment in the United States with a correlation coefficient (R) of 0.380 and weighted average of 5.3%. Similarly, the statistical analysis conducted on geographies consisting of 463,047,668 people shows a strong positive correlation between the proportion of Immigrants from Germany and unemployment in the United States with a correlation coefficient (R) of 0.754 and weighted average of 5.1%, a difference of 4.6%.
Unemployment Correlation Summary
| Measurement | Arab | Immigrants from Germany |
| Minimum | 3.5% | 2.9% |
| Maximum | 26.1% | 100.0% |
| Range | 22.6% | 97.1% |
| Mean | 7.7% | 12.6% |
| Median | 5.7% | 7.2% |
| Interquartile 25% (IQ1) | 4.9% | 4.9% |
| Interquartile 75% (IQ3) | 8.5% | 12.2% |
| Interquartile Range (IQR) | 3.6% | 7.3% |
| Standard Deviation (Sample) | 4.6% | 19.9% |
| Standard Deviation (Population) | 4.6% | 19.5% |
Similar Demographics by Unemployment
Demographics Similar to Arabs by Unemployment
In terms of unemployment, the demographic groups most similar to Arabs are Immigrants from Belarus (5.3%, a difference of 0.020%), Somali (5.3%, a difference of 0.090%), South American (5.3%, a difference of 0.090%), Immigrants from Somalia (5.3%, a difference of 0.10%), and Alsatian (5.3%, a difference of 0.11%).
| Demographics | Rating | Rank | Unemployment |
| Brazilians | 40.2 /100 | #183 | Average 5.3% |
| Assyrians/Chaldeans/Syriacs | 39.2 /100 | #184 | Fair 5.3% |
| Immigrants | Thailand | 38.9 /100 | #185 | Fair 5.3% |
| Immigrants | Uganda | 37.8 /100 | #186 | Fair 5.3% |
| Costa Ricans | 37.4 /100 | #187 | Fair 5.3% |
| Alsatians | 37.0 /100 | #188 | Fair 5.3% |
| Immigrants | Belarus | 35.6 /100 | #189 | Fair 5.3% |
| Arabs | 35.3 /100 | #190 | Fair 5.3% |
| Somalis | 34.0 /100 | #191 | Fair 5.3% |
| South Americans | 33.9 /100 | #192 | Fair 5.3% |
| Immigrants | Somalia | 33.8 /100 | #193 | Fair 5.3% |
| Immigrants | Laos | 30.9 /100 | #194 | Fair 5.3% |
| Immigrants | Southern Europe | 30.9 /100 | #195 | Fair 5.3% |
| Peruvians | 29.9 /100 | #196 | Fair 5.3% |
| Immigrants | Uruguay | 29.8 /100 | #197 | Fair 5.3% |
Demographics Similar to Immigrants from Germany by Unemployment
In terms of unemployment, the demographic groups most similar to Immigrants from Germany are Immigrants from Malaysia (5.1%, a difference of 0.040%), Immigrants from Sri Lanka (5.1%, a difference of 0.050%), Immigrants from Western Europe (5.1%, a difference of 0.070%), Immigrants from France (5.1%, a difference of 0.20%), and Macedonian (5.1%, a difference of 0.21%).
| Demographics | Rating | Rank | Unemployment |
| Chileans | 93.2 /100 | #111 | Exceptional 5.0% |
| South Africans | 92.6 /100 | #112 | Exceptional 5.1% |
| Argentineans | 92.4 /100 | #113 | Exceptional 5.1% |
| Immigrants | Ireland | 92.1 /100 | #114 | Exceptional 5.1% |
| Immigrants | Western Europe | 91.1 /100 | #115 | Exceptional 5.1% |
| Immigrants | Sri Lanka | 91.1 /100 | #116 | Exceptional 5.1% |
| Immigrants | Malaysia | 91.0 /100 | #117 | Exceptional 5.1% |
| Immigrants | Germany | 90.8 /100 | #118 | Exceptional 5.1% |
| Immigrants | France | 89.7 /100 | #119 | Excellent 5.1% |
| Macedonians | 89.7 /100 | #120 | Excellent 5.1% |
| Lebanese | 89.2 /100 | #121 | Excellent 5.1% |
| Immigrants | Switzerland | 89.1 /100 | #122 | Excellent 5.1% |
| Asians | 89.0 /100 | #123 | Excellent 5.1% |
| Ethiopians | 88.6 /100 | #124 | Excellent 5.1% |
| Immigrants | Eastern Asia | 88.3 /100 | #125 | Excellent 5.1% |