Czechoslovakian vs Moroccan Receiving Food Stamps
COMPARE
Czechoslovakian
Moroccan
Receiving Food Stamps
Receiving Food Stamps Comparison
Czechoslovakians
Moroccans
10.3%
RECEIVING FOOD STAMPS
97.2/ 100
METRIC RATING
97th/ 347
METRIC RANK
12.8%
RECEIVING FOOD STAMPS
7.6/ 100
METRIC RATING
213th/ 347
METRIC RANK
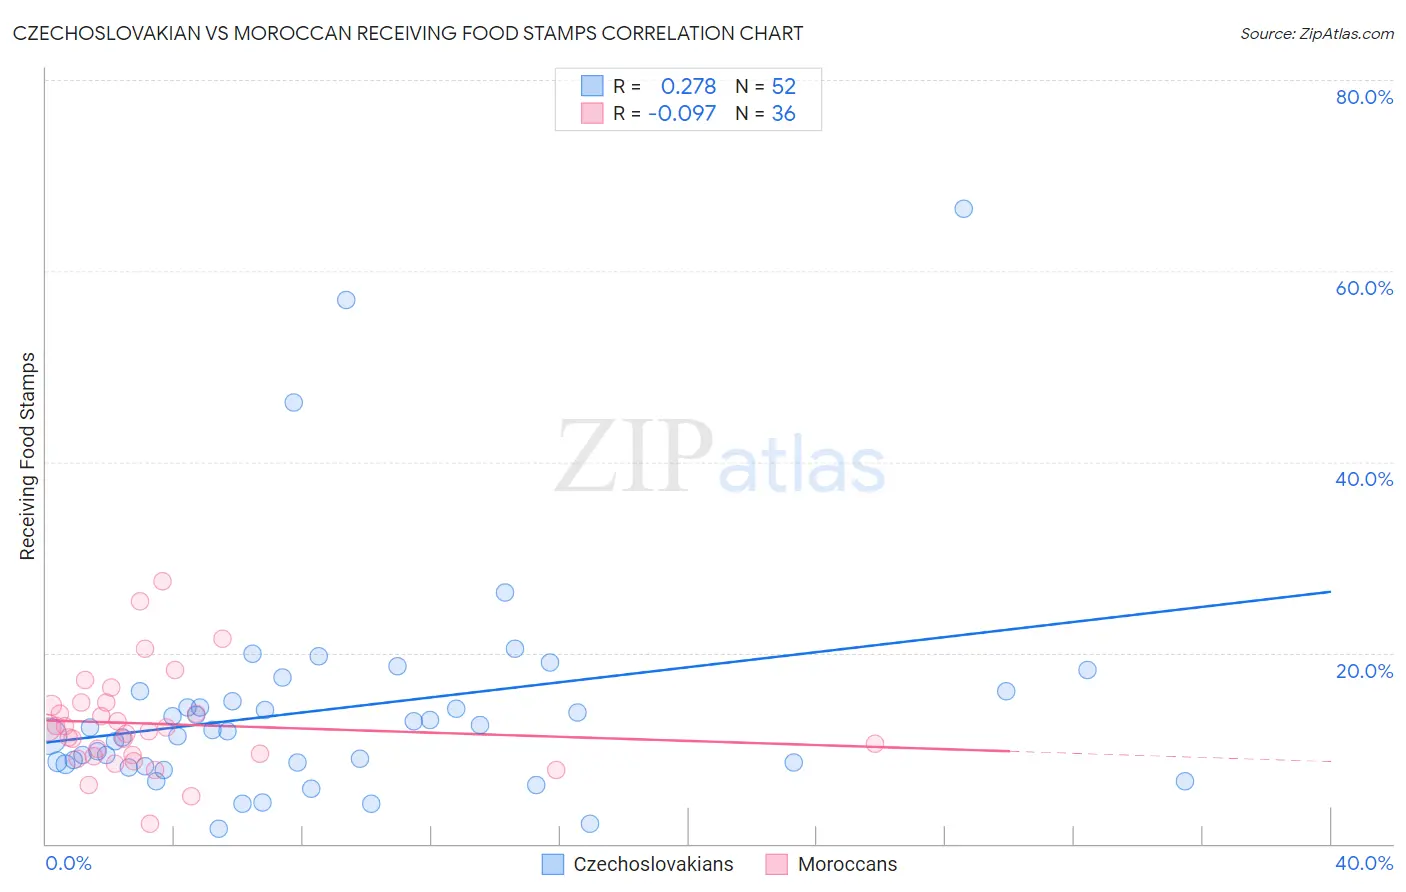
Czechoslovakian vs Moroccan Receiving Food Stamps Correlation Chart
The statistical analysis conducted on geographies consisting of 367,706,231 people shows a weak positive correlation between the proportion of Czechoslovakians and percentage of population receiving government assistance and/or food stamps in the United States with a correlation coefficient (R) of 0.278 and weighted average of 10.3%. Similarly, the statistical analysis conducted on geographies consisting of 201,594,940 people shows a slight negative correlation between the proportion of Moroccans and percentage of population receiving government assistance and/or food stamps in the United States with a correlation coefficient (R) of -0.097 and weighted average of 12.8%, a difference of 24.1%.
Receiving Food Stamps Correlation Summary
| Measurement | Czechoslovakian | Moroccan |
| Minimum | 1.6% | 2.1% |
| Maximum | 66.5% | 27.5% |
| Range | 64.9% | 25.4% |
| Mean | 14.2% | 12.6% |
| Median | 11.9% | 12.0% |
| Interquartile 25% (IQ1) | 8.4% | 9.2% |
| Interquartile 75% (IQ3) | 15.4% | 14.6% |
| Interquartile Range (IQR) | 7.0% | 5.4% |
| Standard Deviation (Sample) | 11.9% | 5.3% |
| Standard Deviation (Population) | 11.8% | 5.2% |
Similar Demographics by Receiving Food Stamps
Demographics Similar to Czechoslovakians by Receiving Food Stamps
In terms of receiving food stamps, the demographic groups most similar to Czechoslovakians are Immigrants from Egypt (10.3%, a difference of 0.060%), Serbian (10.3%, a difference of 0.23%), Welsh (10.3%, a difference of 0.26%), Basque (10.3%, a difference of 0.31%), and Immigrants from Greece (10.3%, a difference of 0.34%).
| Demographics | Rating | Rank | Receiving Food Stamps |
| Finns | 97.9 /100 | #90 | Exceptional 10.2% |
| Jordanians | 97.9 /100 | #91 | Exceptional 10.2% |
| Irish | 97.9 /100 | #92 | Exceptional 10.2% |
| Belgians | 97.7 /100 | #93 | Exceptional 10.2% |
| Immigrants | Greece | 97.4 /100 | #94 | Exceptional 10.3% |
| Basques | 97.4 /100 | #95 | Exceptional 10.3% |
| Welsh | 97.3 /100 | #96 | Exceptional 10.3% |
| Czechoslovakians | 97.2 /100 | #97 | Exceptional 10.3% |
| Immigrants | Egypt | 97.1 /100 | #98 | Exceptional 10.3% |
| Serbians | 97.0 /100 | #99 | Exceptional 10.3% |
| Immigrants | Western Europe | 96.9 /100 | #100 | Exceptional 10.3% |
| Palestinians | 96.9 /100 | #101 | Exceptional 10.3% |
| Immigrants | Europe | 96.8 /100 | #102 | Exceptional 10.3% |
| Immigrants | Latvia | 96.8 /100 | #103 | Exceptional 10.3% |
| Immigrants | Hungary | 96.7 /100 | #104 | Exceptional 10.3% |
Demographics Similar to Moroccans by Receiving Food Stamps
In terms of receiving food stamps, the demographic groups most similar to Moroccans are Immigrants from Africa (12.8%, a difference of 0.030%), Malaysian (12.7%, a difference of 0.40%), Native Hawaiian (12.8%, a difference of 0.47%), Immigrants from South America (12.8%, a difference of 0.58%), and Immigrants from Burma/Myanmar (12.9%, a difference of 0.84%).
| Demographics | Rating | Rank | Receiving Food Stamps |
| Immigrants | Thailand | 17.0 /100 | #206 | Poor 12.4% |
| South Americans | 16.0 /100 | #207 | Poor 12.4% |
| Potawatomi | 14.6 /100 | #208 | Poor 12.5% |
| Immigrants | Sierra Leone | 12.9 /100 | #209 | Poor 12.5% |
| Immigrants | Uruguay | 12.8 /100 | #210 | Poor 12.5% |
| Colombians | 10.2 /100 | #211 | Poor 12.6% |
| Malaysians | 8.5 /100 | #212 | Tragic 12.7% |
| Moroccans | 7.6 /100 | #213 | Tragic 12.8% |
| Immigrants | Africa | 7.6 /100 | #214 | Tragic 12.8% |
| Native Hawaiians | 6.7 /100 | #215 | Tragic 12.8% |
| Immigrants | South America | 6.5 /100 | #216 | Tragic 12.8% |
| Immigrants | Burma/Myanmar | 6.0 /100 | #217 | Tragic 12.9% |
| Hawaiians | 5.4 /100 | #218 | Tragic 12.9% |
| Immigrants | Middle Africa | 5.4 /100 | #219 | Tragic 12.9% |
| Immigrants | Colombia | 5.3 /100 | #220 | Tragic 12.9% |