Immigrants from Poland vs Moroccan Receiving Food Stamps
COMPARE
Immigrants from Poland
Moroccan
Receiving Food Stamps
Receiving Food Stamps Comparison
Immigrants from Poland
Moroccans
10.6%
RECEIVING FOOD STAMPS
93.9/ 100
METRIC RATING
119th/ 347
METRIC RANK
12.8%
RECEIVING FOOD STAMPS
7.6/ 100
METRIC RATING
213th/ 347
METRIC RANK
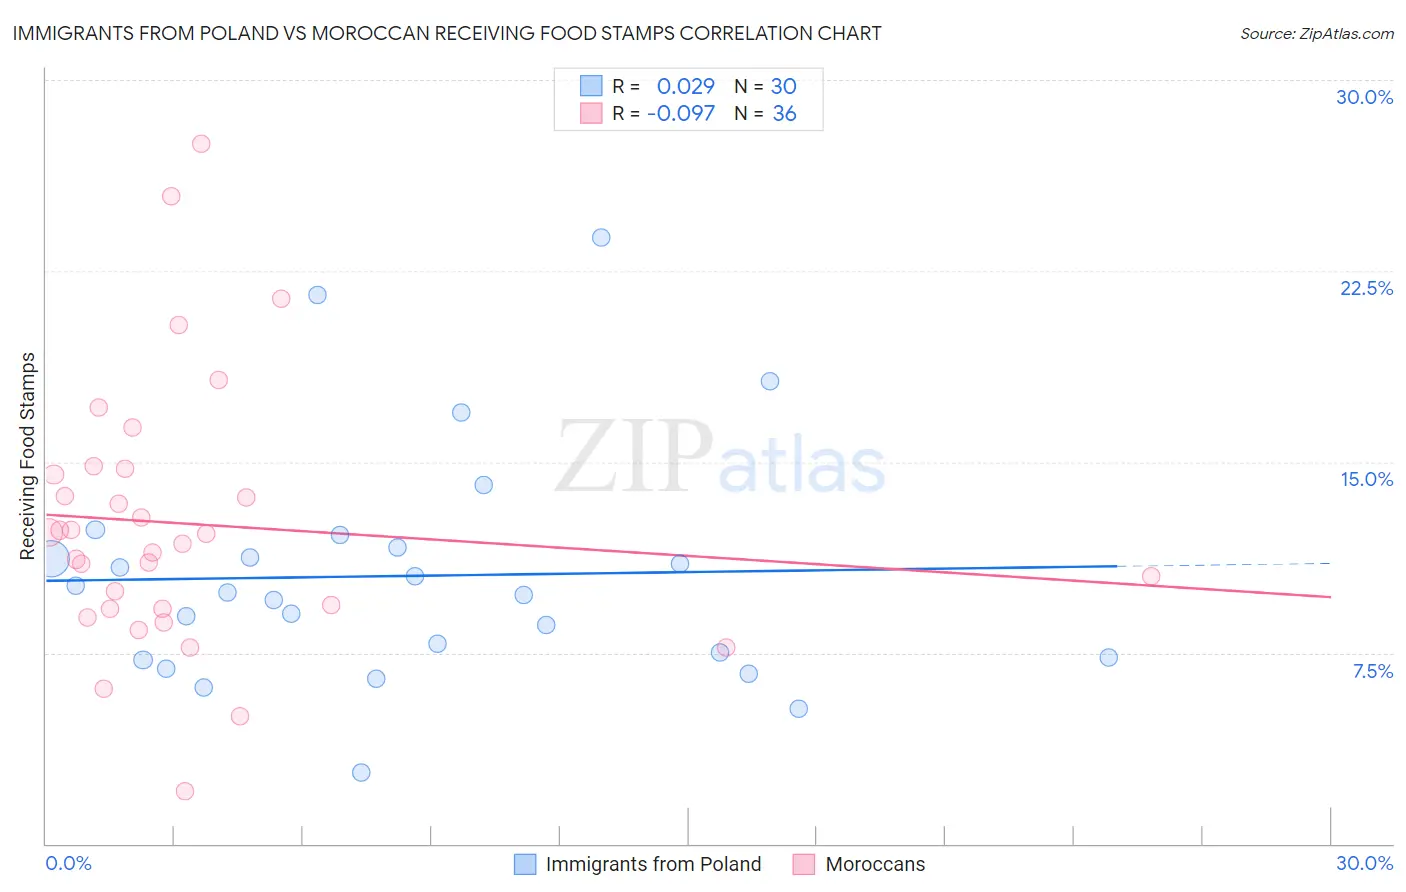
Immigrants from Poland vs Moroccan Receiving Food Stamps Correlation Chart
The statistical analysis conducted on geographies consisting of 304,061,523 people shows no correlation between the proportion of Immigrants from Poland and percentage of population receiving government assistance and/or food stamps in the United States with a correlation coefficient (R) of 0.029 and weighted average of 10.6%. Similarly, the statistical analysis conducted on geographies consisting of 201,594,940 people shows a slight negative correlation between the proportion of Moroccans and percentage of population receiving government assistance and/or food stamps in the United States with a correlation coefficient (R) of -0.097 and weighted average of 12.8%, a difference of 20.2%.
Receiving Food Stamps Correlation Summary
| Measurement | Immigrants from Poland | Moroccan |
| Minimum | 2.8% | 2.1% |
| Maximum | 23.8% | 27.5% |
| Range | 21.0% | 25.4% |
| Mean | 10.5% | 12.6% |
| Median | 9.8% | 12.0% |
| Interquartile 25% (IQ1) | 7.3% | 9.2% |
| Interquartile 75% (IQ3) | 11.6% | 14.6% |
| Interquartile Range (IQR) | 4.3% | 5.4% |
| Standard Deviation (Sample) | 4.6% | 5.3% |
| Standard Deviation (Population) | 4.5% | 5.2% |
Similar Demographics by Receiving Food Stamps
Demographics Similar to Immigrants from Poland by Receiving Food Stamps
In terms of receiving food stamps, the demographic groups most similar to Immigrants from Poland are Ethiopian (10.6%, a difference of 0.0%), Slavic (10.6%, a difference of 0.030%), Sri Lankan (10.6%, a difference of 0.11%), Assyrian/Chaldean/Syriac (10.6%, a difference of 0.16%), and Immigrants from Philippines (10.7%, a difference of 0.36%).
| Demographics | Rating | Rank | Receiving Food Stamps |
| Mongolians | 95.8 /100 | #112 | Exceptional 10.5% |
| Icelanders | 95.4 /100 | #113 | Exceptional 10.5% |
| Scotch-Irish | 95.1 /100 | #114 | Exceptional 10.5% |
| Immigrants | Saudi Arabia | 94.9 /100 | #115 | Exceptional 10.5% |
| Canadians | 94.8 /100 | #116 | Exceptional 10.5% |
| Immigrants | Nepal | 94.6 /100 | #117 | Exceptional 10.6% |
| Assyrians/Chaldeans/Syriacs | 94.1 /100 | #118 | Exceptional 10.6% |
| Immigrants | Poland | 93.9 /100 | #119 | Exceptional 10.6% |
| Ethiopians | 93.9 /100 | #120 | Exceptional 10.6% |
| Slavs | 93.8 /100 | #121 | Exceptional 10.6% |
| Sri Lankans | 93.7 /100 | #122 | Exceptional 10.6% |
| Immigrants | Philippines | 93.3 /100 | #123 | Exceptional 10.7% |
| Paraguayans | 93.0 /100 | #124 | Exceptional 10.7% |
| Ukrainians | 92.8 /100 | #125 | Exceptional 10.7% |
| Afghans | 92.6 /100 | #126 | Exceptional 10.7% |
Demographics Similar to Moroccans by Receiving Food Stamps
In terms of receiving food stamps, the demographic groups most similar to Moroccans are Immigrants from Africa (12.8%, a difference of 0.030%), Malaysian (12.7%, a difference of 0.40%), Native Hawaiian (12.8%, a difference of 0.47%), Immigrants from South America (12.8%, a difference of 0.58%), and Immigrants from Burma/Myanmar (12.9%, a difference of 0.84%).
| Demographics | Rating | Rank | Receiving Food Stamps |
| Immigrants | Thailand | 17.0 /100 | #206 | Poor 12.4% |
| South Americans | 16.0 /100 | #207 | Poor 12.4% |
| Potawatomi | 14.6 /100 | #208 | Poor 12.5% |
| Immigrants | Sierra Leone | 12.9 /100 | #209 | Poor 12.5% |
| Immigrants | Uruguay | 12.8 /100 | #210 | Poor 12.5% |
| Colombians | 10.2 /100 | #211 | Poor 12.6% |
| Malaysians | 8.5 /100 | #212 | Tragic 12.7% |
| Moroccans | 7.6 /100 | #213 | Tragic 12.8% |
| Immigrants | Africa | 7.6 /100 | #214 | Tragic 12.8% |
| Native Hawaiians | 6.7 /100 | #215 | Tragic 12.8% |
| Immigrants | South America | 6.5 /100 | #216 | Tragic 12.8% |
| Immigrants | Burma/Myanmar | 6.0 /100 | #217 | Tragic 12.9% |
| Hawaiians | 5.4 /100 | #218 | Tragic 12.9% |
| Immigrants | Middle Africa | 5.4 /100 | #219 | Tragic 12.9% |
| Immigrants | Colombia | 5.3 /100 | #220 | Tragic 12.9% |