Apache vs Moroccan In Labor Force | Age 30-34
COMPARE
Apache
Moroccan
In Labor Force | Age 30-34
In Labor Force | Age 30-34 Comparison
Apache
Moroccans
79.0%
IN LABOR FORCE | AGE 30-34
0.0/ 100
METRIC RATING
339th/ 347
METRIC RANK
84.6%
IN LABOR FORCE | AGE 30-34
40.3/ 100
METRIC RATING
181st/ 347
METRIC RANK
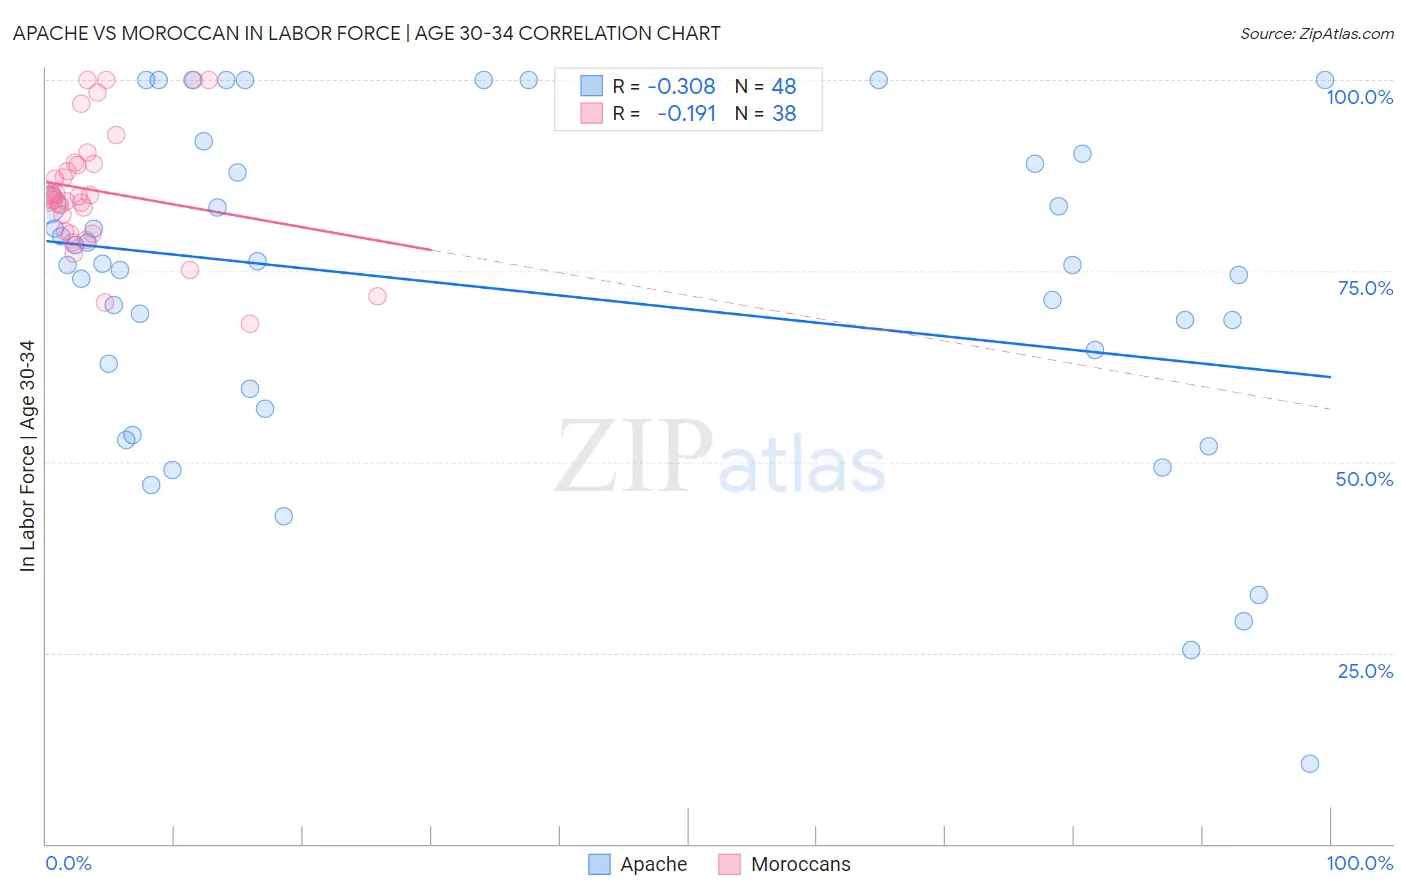
Apache vs Moroccan In Labor Force | Age 30-34 Correlation Chart
The statistical analysis conducted on geographies consisting of 231,033,691 people shows a mild negative correlation between the proportion of Apache and labor force participation rate among population between the ages 30 and 34 in the United States with a correlation coefficient (R) of -0.308 and weighted average of 79.0%. Similarly, the statistical analysis conducted on geographies consisting of 201,755,147 people shows a poor negative correlation between the proportion of Moroccans and labor force participation rate among population between the ages 30 and 34 in the United States with a correlation coefficient (R) of -0.191 and weighted average of 84.6%, a difference of 7.1%.
In Labor Force | Age 30-34 Correlation Summary
| Measurement | Apache | Moroccan |
| Minimum | 10.5% | 68.1% |
| Maximum | 100.0% | 100.0% |
| Range | 89.5% | 31.9% |
| Mean | 72.3% | 85.5% |
| Median | 75.7% | 84.7% |
| Interquartile 25% (IQ1) | 58.3% | 80.2% |
| Interquartile 75% (IQ3) | 88.5% | 89.0% |
| Interquartile Range (IQR) | 30.2% | 8.8% |
| Standard Deviation (Sample) | 21.9% | 8.0% |
| Standard Deviation (Population) | 21.7% | 7.9% |
Similar Demographics by In Labor Force | Age 30-34
Demographics Similar to Apache by In Labor Force | Age 30-34
In terms of in labor force | age 30-34, the demographic groups most similar to Apache are Pima (79.0%, a difference of 0.030%), Ute (78.9%, a difference of 0.10%), Yakama (79.1%, a difference of 0.15%), Native/Alaskan (79.2%, a difference of 0.19%), and Marshallese (79.2%, a difference of 0.27%).
| Demographics | Rating | Rank | In Labor Force | Age 30-34 |
| Kiowa | 0.0 /100 | #332 | Tragic 79.8% |
| Inupiat | 0.0 /100 | #333 | Tragic 79.7% |
| Hopi | 0.0 /100 | #334 | Tragic 79.3% |
| Marshallese | 0.0 /100 | #335 | Tragic 79.2% |
| Natives/Alaskans | 0.0 /100 | #336 | Tragic 79.2% |
| Yakama | 0.0 /100 | #337 | Tragic 79.1% |
| Pima | 0.0 /100 | #338 | Tragic 79.0% |
| Apache | 0.0 /100 | #339 | Tragic 79.0% |
| Ute | 0.0 /100 | #340 | Tragic 78.9% |
| Immigrants | Yemen | 0.0 /100 | #341 | Tragic 78.2% |
| Tohono O'odham | 0.0 /100 | #342 | Tragic 77.7% |
| Lumbee | 0.0 /100 | #343 | Tragic 77.3% |
| Yuman | 0.0 /100 | #344 | Tragic 77.1% |
| Yup'ik | 0.0 /100 | #345 | Tragic 76.4% |
| Crow | 0.0 /100 | #346 | Tragic 75.9% |
Demographics Similar to Moroccans by In Labor Force | Age 30-34
In terms of in labor force | age 30-34, the demographic groups most similar to Moroccans are Immigrants from Netherlands (84.6%, a difference of 0.010%), Immigrants from Nigeria (84.6%, a difference of 0.020%), Okinawan (84.6%, a difference of 0.030%), Barbadian (84.6%, a difference of 0.030%), and Immigrants from Canada (84.6%, a difference of 0.040%).
| Demographics | Rating | Rank | In Labor Force | Age 30-34 |
| Finns | 50.0 /100 | #174 | Average 84.7% |
| Immigrants | South America | 50.0 /100 | #175 | Average 84.7% |
| Immigrants | Uzbekistan | 49.1 /100 | #176 | Average 84.7% |
| Laotians | 46.9 /100 | #177 | Average 84.7% |
| Okinawans | 44.1 /100 | #178 | Average 84.6% |
| Immigrants | Nigeria | 42.5 /100 | #179 | Average 84.6% |
| Immigrants | Netherlands | 42.1 /100 | #180 | Average 84.6% |
| Moroccans | 40.3 /100 | #181 | Average 84.6% |
| Barbadians | 36.7 /100 | #182 | Fair 84.6% |
| Immigrants | Canada | 35.0 /100 | #183 | Fair 84.6% |
| Immigrants | North America | 33.3 /100 | #184 | Fair 84.6% |
| Immigrants | Philippines | 31.5 /100 | #185 | Fair 84.6% |
| Immigrants | Congo | 29.7 /100 | #186 | Fair 84.6% |
| Costa Ricans | 29.6 /100 | #187 | Fair 84.6% |
| Taiwanese | 29.4 /100 | #188 | Fair 84.6% |