Apache vs Immigrants from Greece Disability Age 35 to 64
COMPARE
Apache
Immigrants from Greece
Disability Age 35 to 64
Disability Age 35 to 64 Comparison
Apache
Immigrants from Greece
14.9%
DISABILITY AGE 35 TO 64
0.0/ 100
METRIC RATING
323rd/ 347
METRIC RANK
9.8%
DISABILITY AGE 35 TO 64
99.8/ 100
METRIC RATING
49th/ 347
METRIC RANK
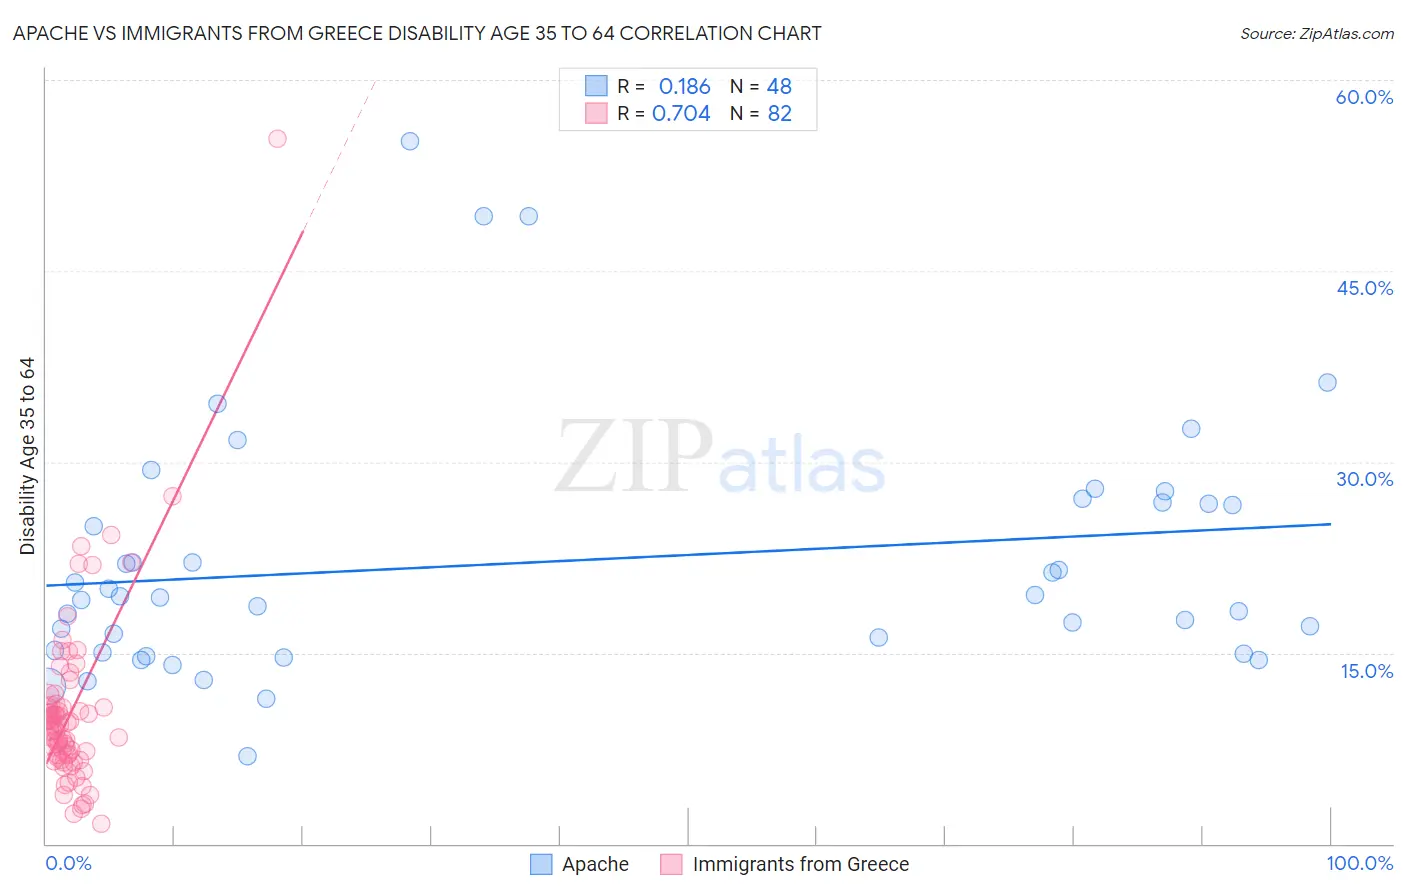
Apache vs Immigrants from Greece Disability Age 35 to 64 Correlation Chart
The statistical analysis conducted on geographies consisting of 231,024,095 people shows a poor positive correlation between the proportion of Apache and percentage of population with a disability between the ages 34 and 64 in the United States with a correlation coefficient (R) of 0.186 and weighted average of 14.9%. Similarly, the statistical analysis conducted on geographies consisting of 216,854,887 people shows a strong positive correlation between the proportion of Immigrants from Greece and percentage of population with a disability between the ages 34 and 64 in the United States with a correlation coefficient (R) of 0.704 and weighted average of 9.8%, a difference of 52.0%.
Disability Age 35 to 64 Correlation Summary
| Measurement | Apache | Immigrants from Greece |
| Minimum | 6.9% | 1.5% |
| Maximum | 55.2% | 55.4% |
| Range | 48.3% | 53.9% |
| Mean | 22.1% | 10.4% |
| Median | 19.4% | 9.2% |
| Interquartile 25% (IQ1) | 15.1% | 7.0% |
| Interquartile 75% (IQ3) | 26.8% | 10.7% |
| Interquartile Range (IQR) | 11.7% | 3.7% |
| Standard Deviation (Sample) | 9.9% | 7.1% |
| Standard Deviation (Population) | 9.8% | 7.1% |
Similar Demographics by Disability Age 35 to 64
Demographics Similar to Apache by Disability Age 35 to 64
In terms of disability age 35 to 64, the demographic groups most similar to Apache are Chippewa (15.0%, a difference of 0.20%), Arapaho (15.1%, a difference of 0.87%), Potawatomi (14.8%, a difference of 1.2%), Comanche (14.7%, a difference of 1.3%), and Black/African American (14.7%, a difference of 1.5%).
| Demographics | Rating | Rank | Disability Age 35 to 64 |
| Osage | 0.0 /100 | #316 | Tragic 14.5% |
| Crow | 0.0 /100 | #317 | Tragic 14.6% |
| Ottawa | 0.0 /100 | #318 | Tragic 14.6% |
| Immigrants | Cabo Verde | 0.0 /100 | #319 | Tragic 14.7% |
| Blacks/African Americans | 0.0 /100 | #320 | Tragic 14.7% |
| Comanche | 0.0 /100 | #321 | Tragic 14.7% |
| Potawatomi | 0.0 /100 | #322 | Tragic 14.8% |
| Apache | 0.0 /100 | #323 | Tragic 14.9% |
| Chippewa | 0.0 /100 | #324 | Tragic 15.0% |
| Arapaho | 0.0 /100 | #325 | Tragic 15.1% |
| Natives/Alaskans | 0.0 /100 | #326 | Tragic 15.3% |
| Pueblo | 0.0 /100 | #327 | Tragic 15.3% |
| Cajuns | 0.0 /100 | #328 | Tragic 15.3% |
| Cherokee | 0.0 /100 | #329 | Tragic 15.5% |
| Navajo | 0.0 /100 | #330 | Tragic 15.5% |
Demographics Similar to Immigrants from Greece by Disability Age 35 to 64
In terms of disability age 35 to 64, the demographic groups most similar to Immigrants from Greece are Immigrants from Serbia (9.8%, a difference of 0.040%), Immigrants from Belgium (9.8%, a difference of 0.050%), Paraguayan (9.8%, a difference of 0.070%), Cambodian (9.8%, a difference of 0.11%), and Bhutanese (9.8%, a difference of 0.15%).
| Demographics | Rating | Rank | Disability Age 35 to 64 |
| Immigrants | Malaysia | 99.9 /100 | #42 | Exceptional 9.7% |
| Immigrants | Colombia | 99.9 /100 | #43 | Exceptional 9.8% |
| Immigrants | Egypt | 99.9 /100 | #44 | Exceptional 9.8% |
| Immigrants | Peru | 99.9 /100 | #45 | Exceptional 9.8% |
| Cambodians | 99.8 /100 | #46 | Exceptional 9.8% |
| Immigrants | Belgium | 99.8 /100 | #47 | Exceptional 9.8% |
| Immigrants | Serbia | 99.8 /100 | #48 | Exceptional 9.8% |
| Immigrants | Greece | 99.8 /100 | #49 | Exceptional 9.8% |
| Paraguayans | 99.8 /100 | #50 | Exceptional 9.8% |
| Bhutanese | 99.8 /100 | #51 | Exceptional 9.8% |
| Immigrants | Bulgaria | 99.8 /100 | #52 | Exceptional 9.8% |
| Taiwanese | 99.8 /100 | #53 | Exceptional 9.8% |
| Immigrants | Russia | 99.8 /100 | #54 | Exceptional 9.8% |
| Peruvians | 99.8 /100 | #55 | Exceptional 9.9% |
| South Americans | 99.8 /100 | #56 | Exceptional 9.9% |