Apache vs Immigrants from Greece No Schooling Completed
COMPARE
Apache
Immigrants from Greece
No Schooling Completed
No Schooling Completed Comparison
Apache
Immigrants from Greece
2.1%
NO SCHOOLING COMPLETED
56.7/ 100
METRIC RATING
169th/ 347
METRIC RANK
2.0%
NO SCHOOLING COMPLETED
83.5/ 100
METRIC RATING
141st/ 347
METRIC RANK
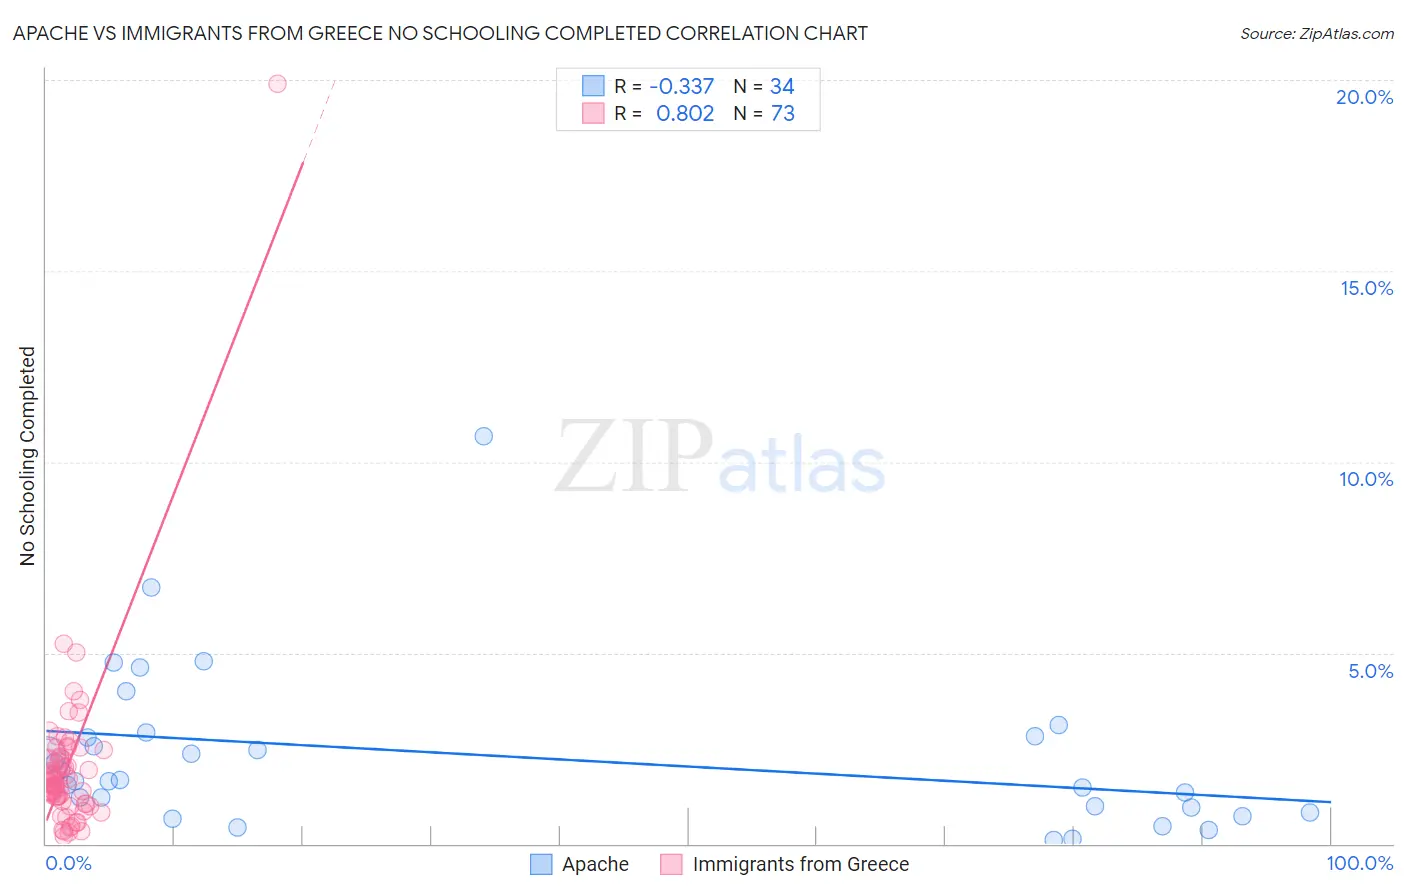
Apache vs Immigrants from Greece No Schooling Completed Correlation Chart
The statistical analysis conducted on geographies consisting of 229,858,613 people shows a mild negative correlation between the proportion of Apache and percentage of population with no schooling in the United States with a correlation coefficient (R) of -0.337 and weighted average of 2.1%. Similarly, the statistical analysis conducted on geographies consisting of 215,786,683 people shows a very strong positive correlation between the proportion of Immigrants from Greece and percentage of population with no schooling in the United States with a correlation coefficient (R) of 0.802 and weighted average of 2.0%, a difference of 4.8%.
No Schooling Completed Correlation Summary
| Measurement | Apache | Immigrants from Greece |
| Minimum | 0.098% | 0.20% |
| Maximum | 10.7% | 19.9% |
| Range | 10.6% | 19.7% |
| Mean | 2.3% | 2.0% |
| Median | 1.7% | 1.6% |
| Interquartile 25% (IQ1) | 0.95% | 1.2% |
| Interquartile 75% (IQ3) | 2.8% | 2.2% |
| Interquartile Range (IQR) | 1.9% | 1.1% |
| Standard Deviation (Sample) | 2.1% | 2.3% |
| Standard Deviation (Population) | 2.1% | 2.3% |
Similar Demographics by No Schooling Completed
Demographics Similar to Apache by No Schooling Completed
In terms of no schooling completed, the demographic groups most similar to Apache are Argentinean (2.1%, a difference of 0.090%), Immigrants from Poland (2.1%, a difference of 0.20%), Cheyenne (2.1%, a difference of 0.27%), Egyptian (2.1%, a difference of 0.35%), and Dutch West Indian (2.1%, a difference of 0.46%).
| Demographics | Rating | Rank | No Schooling Completed |
| Immigrants | Brazil | 63.8 /100 | #162 | Good 2.1% |
| Albanians | 62.2 /100 | #163 | Good 2.1% |
| Comanche | 60.7 /100 | #164 | Good 2.1% |
| Brazilians | 60.2 /100 | #165 | Good 2.1% |
| Dutch West Indians | 59.9 /100 | #166 | Average 2.1% |
| Egyptians | 59.2 /100 | #167 | Average 2.1% |
| Cheyenne | 58.6 /100 | #168 | Average 2.1% |
| Apache | 56.7 /100 | #169 | Average 2.1% |
| Argentineans | 56.0 /100 | #170 | Average 2.1% |
| Immigrants | Poland | 55.2 /100 | #171 | Average 2.1% |
| Immigrants | Argentina | 52.7 /100 | #172 | Average 2.1% |
| Immigrants | Belarus | 51.8 /100 | #173 | Average 2.1% |
| Immigrants | Micronesia | 50.0 /100 | #174 | Average 2.1% |
| Arabs | 46.4 /100 | #175 | Average 2.1% |
| Panamanians | 45.2 /100 | #176 | Average 2.1% |
Demographics Similar to Immigrants from Greece by No Schooling Completed
In terms of no schooling completed, the demographic groups most similar to Immigrants from Greece are Marshallese (2.0%, a difference of 0.010%), Jordanian (2.0%, a difference of 0.27%), Venezuelan (2.0%, a difference of 0.49%), Immigrants from Israel (2.0%, a difference of 0.52%), and Filipino (2.0%, a difference of 0.56%).
| Demographics | Rating | Rank | No Schooling Completed |
| Menominee | 89.6 /100 | #134 | Excellent 1.9% |
| Hmong | 88.5 /100 | #135 | Excellent 1.9% |
| Burmese | 88.2 /100 | #136 | Excellent 1.9% |
| Filipinos | 85.5 /100 | #137 | Excellent 2.0% |
| Immigrants | Israel | 85.4 /100 | #138 | Excellent 2.0% |
| Jordanians | 84.5 /100 | #139 | Excellent 2.0% |
| Marshallese | 83.5 /100 | #140 | Excellent 2.0% |
| Immigrants | Greece | 83.5 /100 | #141 | Excellent 2.0% |
| Venezuelans | 81.5 /100 | #142 | Excellent 2.0% |
| Immigrants | South Central Asia | 80.0 /100 | #143 | Good 2.0% |
| Alsatians | 79.1 /100 | #144 | Good 2.0% |
| Immigrants | Iran | 79.0 /100 | #145 | Good 2.0% |
| Immigrants | Moldova | 78.0 /100 | #146 | Good 2.0% |
| Soviet Union | 77.1 /100 | #147 | Good 2.0% |
| Shoshone | 76.7 /100 | #148 | Good 2.0% |