Apache vs Immigrants from Greece Single Father Households
COMPARE
Apache
Immigrants from Greece
Single Father Households
Single Father Households Comparison
Apache
Immigrants from Greece
2.8%
SINGLE FATHER HOUSEHOLDS
0.0/ 100
METRIC RATING
308th/ 347
METRIC RANK
1.9%
SINGLE FATHER HOUSEHOLDS
100.0/ 100
METRIC RATING
12th/ 347
METRIC RANK
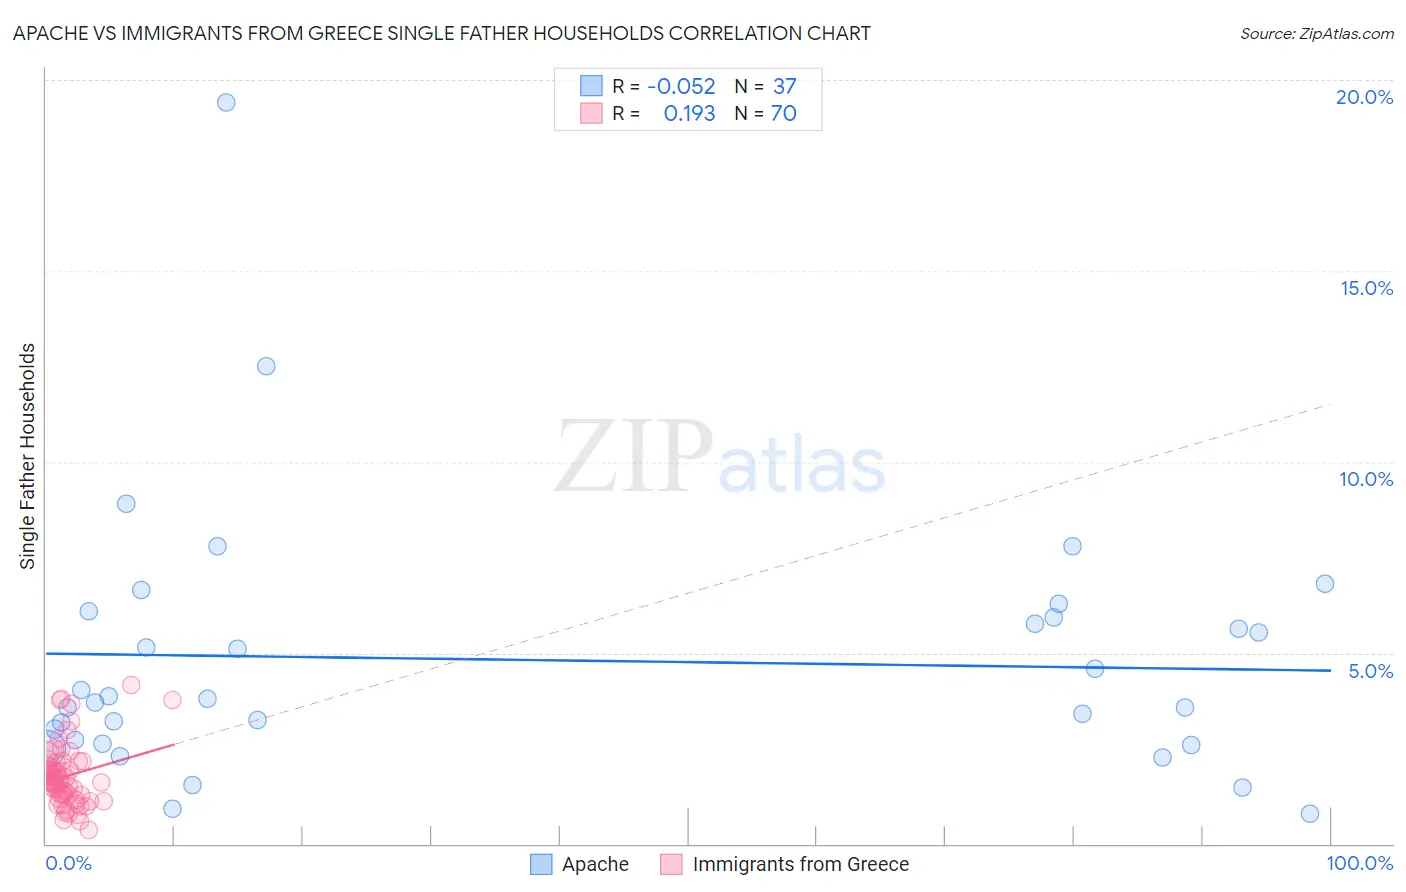
Apache vs Immigrants from Greece Single Father Households Correlation Chart
The statistical analysis conducted on geographies consisting of 230,074,281 people shows a slight negative correlation between the proportion of Apache and percentage of single father households in the United States with a correlation coefficient (R) of -0.052 and weighted average of 2.8%. Similarly, the statistical analysis conducted on geographies consisting of 215,474,728 people shows a poor positive correlation between the proportion of Immigrants from Greece and percentage of single father households in the United States with a correlation coefficient (R) of 0.193 and weighted average of 1.9%, a difference of 51.8%.
Single Father Households Correlation Summary
| Measurement | Apache | Immigrants from Greece |
| Minimum | 0.80% | 0.34% |
| Maximum | 19.4% | 4.2% |
| Range | 18.6% | 3.8% |
| Mean | 4.8% | 1.8% |
| Median | 3.8% | 1.7% |
| Interquartile 25% (IQ1) | 2.7% | 1.3% |
| Interquartile 75% (IQ3) | 6.0% | 2.0% |
| Interquartile Range (IQR) | 3.3% | 0.73% |
| Standard Deviation (Sample) | 3.4% | 0.80% |
| Standard Deviation (Population) | 3.4% | 0.79% |
Similar Demographics by Single Father Households
Demographics Similar to Apache by Single Father Households
In terms of single father households, the demographic groups most similar to Apache are Hopi (2.8%, a difference of 0.18%), Immigrants from the Azores (2.8%, a difference of 0.35%), Hispanic or Latino (2.8%, a difference of 0.50%), Mexican American Indian (2.8%, a difference of 0.66%), and Central American (2.9%, a difference of 0.71%).
| Demographics | Rating | Rank | Single Father Households |
| Immigrants | Latin America | 0.0 /100 | #301 | Tragic 2.8% |
| Spanish Americans | 0.0 /100 | #302 | Tragic 2.8% |
| Immigrants | Honduras | 0.0 /100 | #303 | Tragic 2.8% |
| Mexican American Indians | 0.0 /100 | #304 | Tragic 2.8% |
| Hispanics or Latinos | 0.0 /100 | #305 | Tragic 2.8% |
| Immigrants | Azores | 0.0 /100 | #306 | Tragic 2.8% |
| Hopi | 0.0 /100 | #307 | Tragic 2.8% |
| Apache | 0.0 /100 | #308 | Tragic 2.8% |
| Central Americans | 0.0 /100 | #309 | Tragic 2.9% |
| Immigrants | Laos | 0.0 /100 | #310 | Tragic 2.9% |
| Spanish American Indians | 0.0 /100 | #311 | Tragic 2.9% |
| Tsimshian | 0.0 /100 | #312 | Tragic 2.9% |
| Arapaho | 0.0 /100 | #313 | Tragic 2.9% |
| Salvadorans | 0.0 /100 | #314 | Tragic 2.9% |
| Cheyenne | 0.0 /100 | #315 | Tragic 2.9% |
Demographics Similar to Immigrants from Greece by Single Father Households
In terms of single father households, the demographic groups most similar to Immigrants from Greece are Immigrants from Singapore (1.9%, a difference of 0.030%), Immigrants from Belarus (1.9%, a difference of 0.44%), Okinawan (1.9%, a difference of 0.76%), Immigrants from Lithuania (1.9%, a difference of 1.0%), and Immigrants from China (1.8%, a difference of 1.1%).
| Demographics | Rating | Rank | Single Father Households |
| Immigrants | Hong Kong | 100.0 /100 | #5 | Exceptional 1.8% |
| Immigrants | Taiwan | 100.0 /100 | #6 | Exceptional 1.8% |
| Cypriots | 100.0 /100 | #7 | Exceptional 1.8% |
| Immigrants | Ireland | 100.0 /100 | #8 | Exceptional 1.8% |
| Immigrants | China | 100.0 /100 | #9 | Exceptional 1.8% |
| Okinawans | 100.0 /100 | #10 | Exceptional 1.9% |
| Immigrants | Belarus | 100.0 /100 | #11 | Exceptional 1.9% |
| Immigrants | Greece | 100.0 /100 | #12 | Exceptional 1.9% |
| Immigrants | Singapore | 100.0 /100 | #13 | Exceptional 1.9% |
| Immigrants | Lithuania | 100.0 /100 | #14 | Exceptional 1.9% |
| Immigrants | Eastern Asia | 100.0 /100 | #15 | Exceptional 1.9% |
| Immigrants | Iran | 100.0 /100 | #16 | Exceptional 1.9% |
| Immigrants | India | 100.0 /100 | #17 | Exceptional 1.9% |
| Indians (Asian) | 100.0 /100 | #18 | Exceptional 1.9% |
| Iranians | 100.0 /100 | #19 | Exceptional 1.9% |