Immigrants from Portugal vs Cree Receiving Food Stamps
COMPARE
Immigrants from Portugal
Cree
Receiving Food Stamps
Receiving Food Stamps Comparison
Immigrants from Portugal
Cree
14.3%
RECEIVING FOOD STAMPS
0.2/ 100
METRIC RATING
263rd/ 347
METRIC RANK
13.7%
RECEIVING FOOD STAMPS
0.8/ 100
METRIC RATING
246th/ 347
METRIC RANK
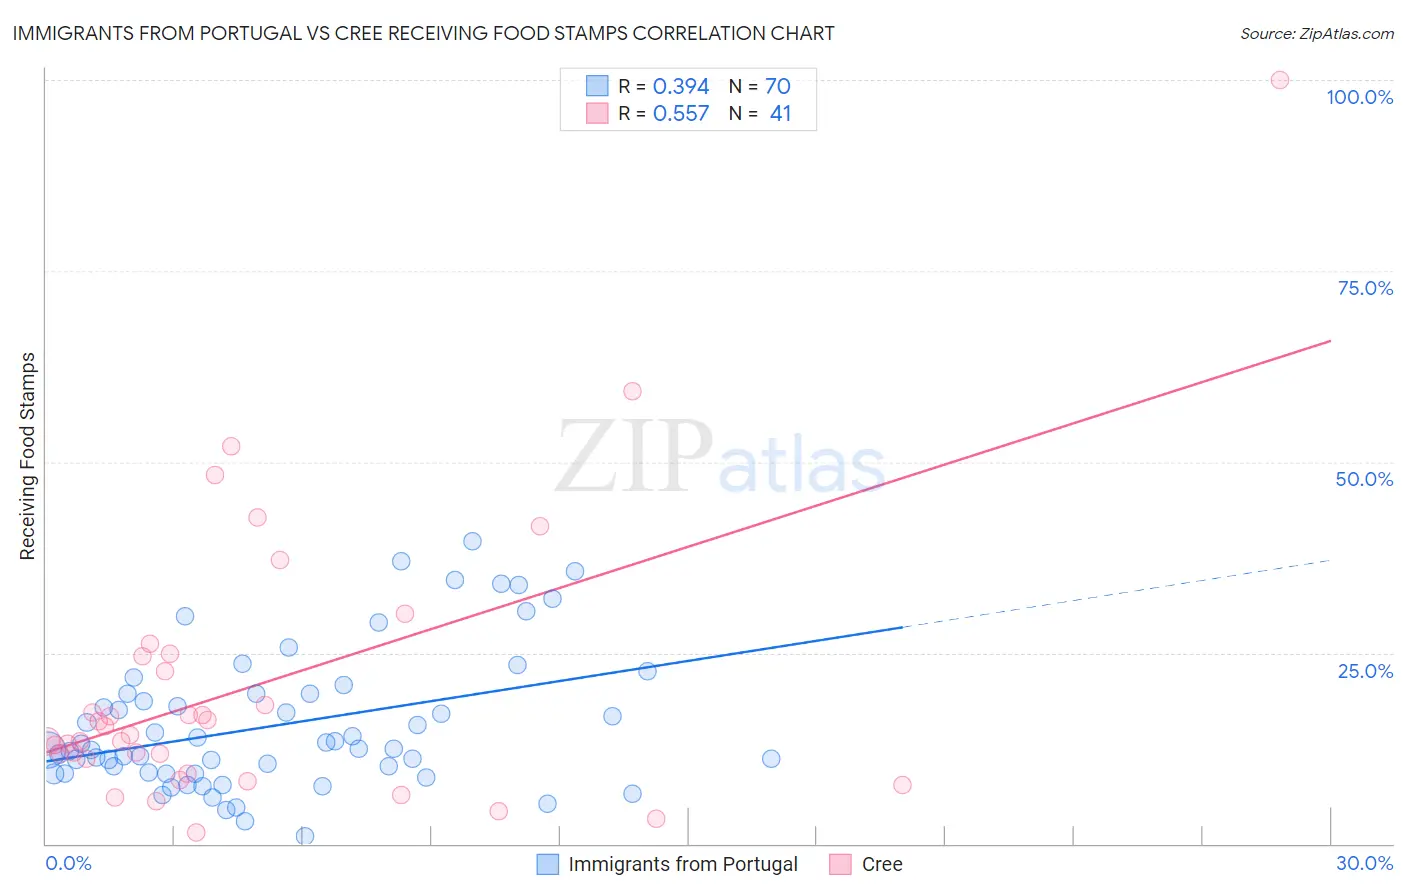
Immigrants from Portugal vs Cree Receiving Food Stamps Correlation Chart
The statistical analysis conducted on geographies consisting of 174,504,532 people shows a mild positive correlation between the proportion of Immigrants from Portugal and percentage of population receiving government assistance and/or food stamps in the United States with a correlation coefficient (R) of 0.394 and weighted average of 14.3%. Similarly, the statistical analysis conducted on geographies consisting of 76,186,239 people shows a substantial positive correlation between the proportion of Cree and percentage of population receiving government assistance and/or food stamps in the United States with a correlation coefficient (R) of 0.557 and weighted average of 13.7%, a difference of 4.0%.
Receiving Food Stamps Correlation Summary
| Measurement | Immigrants from Portugal | Cree |
| Minimum | 1.0% | 1.5% |
| Maximum | 39.6% | 100.0% |
| Range | 38.6% | 98.5% |
| Mean | 15.6% | 20.6% |
| Median | 12.4% | 14.2% |
| Interquartile 25% (IQ1) | 9.2% | 10.1% |
| Interquartile 75% (IQ3) | 19.6% | 24.7% |
| Interquartile Range (IQR) | 10.4% | 14.6% |
| Standard Deviation (Sample) | 9.0% | 18.6% |
| Standard Deviation (Population) | 9.0% | 18.4% |
Demographics Similar to Immigrants from Portugal and Cree by Receiving Food Stamps
In terms of receiving food stamps, the demographic groups most similar to Immigrants from Portugal are Paiute (14.3%, a difference of 0.0%), Immigrants from Uzbekistan (14.3%, a difference of 0.090%), Immigrants from Congo (14.1%, a difference of 0.79%), Central American (14.1%, a difference of 0.80%), and Creek (14.1%, a difference of 0.90%). Similarly, the demographic groups most similar to Cree are Immigrants from Somalia (13.7%, a difference of 0.24%), Mexican American Indian (13.8%, a difference of 0.27%), Cajun (13.7%, a difference of 0.28%), Immigrants from Laos (13.8%, a difference of 0.36%), and Indonesian (13.9%, a difference of 1.0%).
| Demographics | Rating | Rank | Receiving Food Stamps |
| Cajuns | 0.9 /100 | #244 | Tragic 13.7% |
| Immigrants | Somalia | 0.9 /100 | #245 | Tragic 13.7% |
| Cree | 0.8 /100 | #246 | Tragic 13.7% |
| Mexican American Indians | 0.7 /100 | #247 | Tragic 13.8% |
| Immigrants | Laos | 0.7 /100 | #248 | Tragic 13.8% |
| Indonesians | 0.6 /100 | #249 | Tragic 13.9% |
| Immigrants | Cambodia | 0.5 /100 | #250 | Tragic 13.9% |
| Yaqui | 0.5 /100 | #251 | Tragic 13.9% |
| Ghanaians | 0.5 /100 | #252 | Tragic 14.0% |
| Spanish Americans | 0.4 /100 | #253 | Tragic 14.0% |
| Marshallese | 0.3 /100 | #254 | Tragic 14.1% |
| Sub-Saharan Africans | 0.3 /100 | #255 | Tragic 14.1% |
| Japanese | 0.3 /100 | #256 | Tragic 14.1% |
| Arapaho | 0.3 /100 | #257 | Tragic 14.1% |
| Immigrants | Ghana | 0.3 /100 | #258 | Tragic 14.1% |
| Creek | 0.3 /100 | #259 | Tragic 14.1% |
| Central Americans | 0.3 /100 | #260 | Tragic 14.1% |
| Immigrants | Congo | 0.3 /100 | #261 | Tragic 14.1% |
| Paiute | 0.2 /100 | #262 | Tragic 14.3% |
| Immigrants | Portugal | 0.2 /100 | #263 | Tragic 14.3% |
| Immigrants | Uzbekistan | 0.2 /100 | #264 | Tragic 14.3% |