Apache vs Cree Male Disability
COMPARE
Apache
Cree
Male Disability
Male Disability Comparison
Apache
Cree
14.0%
MALE DISABILITY
0.0/ 100
METRIC RATING
322nd/ 347
METRIC RANK
13.7%
MALE DISABILITY
0.0/ 100
METRIC RATING
318th/ 347
METRIC RANK
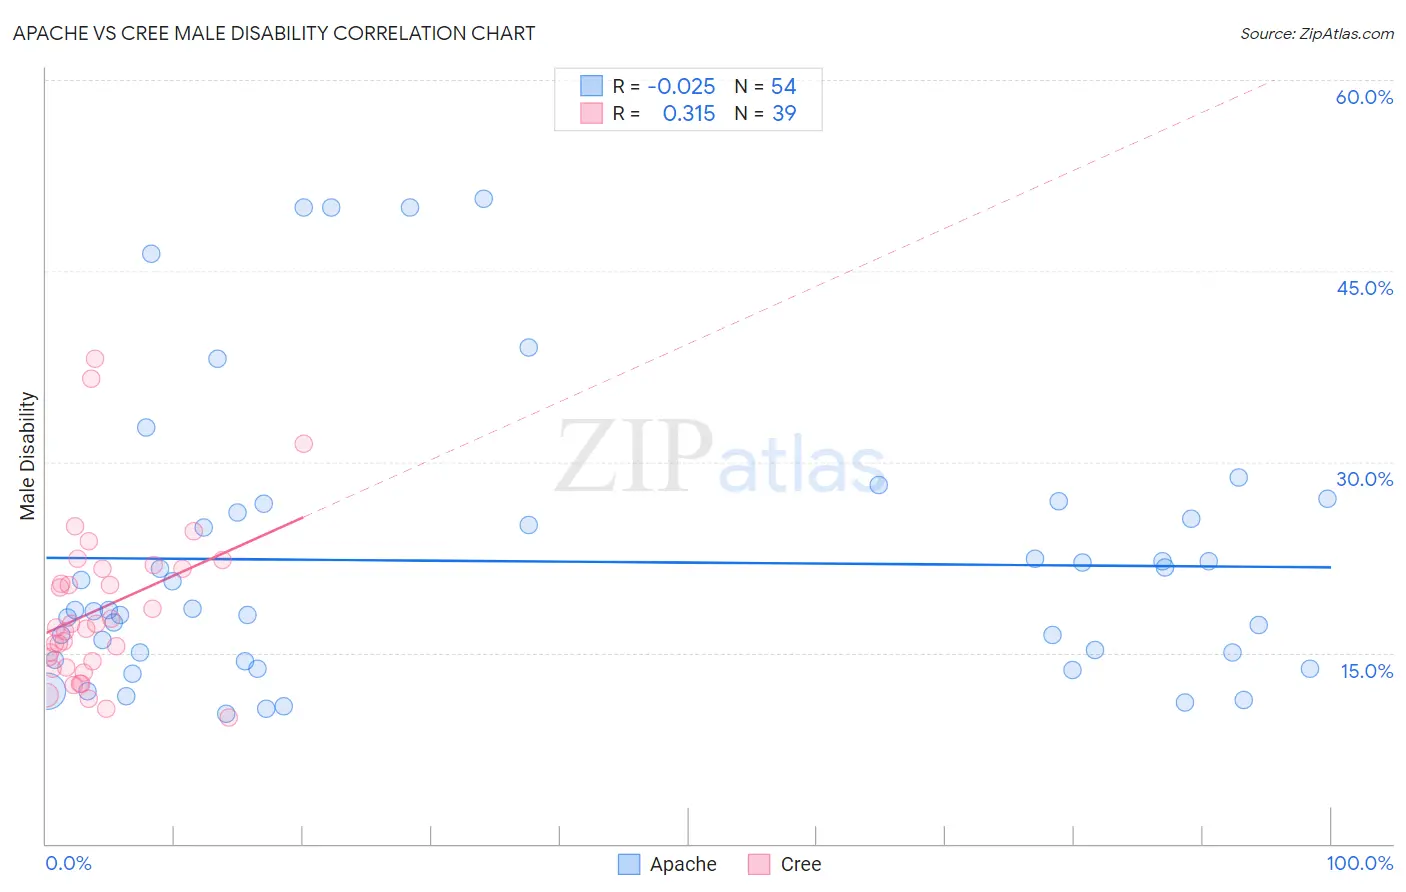
Apache vs Cree Male Disability Correlation Chart
The statistical analysis conducted on geographies consisting of 231,062,399 people shows no correlation between the proportion of Apache and percentage of males with a disability in the United States with a correlation coefficient (R) of -0.025 and weighted average of 14.0%. Similarly, the statistical analysis conducted on geographies consisting of 76,208,606 people shows a mild positive correlation between the proportion of Cree and percentage of males with a disability in the United States with a correlation coefficient (R) of 0.315 and weighted average of 13.7%, a difference of 2.1%.
Male Disability Correlation Summary
| Measurement | Apache | Cree |
| Minimum | 10.2% | 9.9% |
| Maximum | 50.7% | 38.1% |
| Range | 40.5% | 28.2% |
| Mean | 22.2% | 18.5% |
| Median | 18.3% | 17.0% |
| Interquartile 25% (IQ1) | 14.5% | 13.9% |
| Interquartile 75% (IQ3) | 26.0% | 21.6% |
| Interquartile Range (IQR) | 11.6% | 7.7% |
| Standard Deviation (Sample) | 11.0% | 6.4% |
| Standard Deviation (Population) | 10.9% | 6.3% |
Demographics Similar to Apache and Cree by Male Disability
In terms of male disability, the demographic groups most similar to Apache are Osage (14.0%, a difference of 0.070%), Comanche (14.1%, a difference of 0.40%), Ottawa (14.1%, a difference of 0.51%), Shoshone (13.8%, a difference of 1.1%), and Tlingit-Haida (13.8%, a difference of 1.2%). Similarly, the demographic groups most similar to Cree are Paiute (13.7%, a difference of 0.21%), American (13.8%, a difference of 0.41%), Tlingit-Haida (13.8%, a difference of 0.90%), Shoshone (13.8%, a difference of 0.96%), and Alaska Native (13.6%, a difference of 1.0%).
| Demographics | Rating | Rank | Male Disability |
| Immigrants | Azores | 0.0 /100 | #310 | Tragic 13.4% |
| Delaware | 0.0 /100 | #311 | Tragic 13.5% |
| Yakama | 0.0 /100 | #312 | Tragic 13.5% |
| Puget Sound Salish | 0.0 /100 | #313 | Tragic 13.5% |
| Aleuts | 0.0 /100 | #314 | Tragic 13.5% |
| Iroquois | 0.0 /100 | #315 | Tragic 13.6% |
| Alaska Natives | 0.0 /100 | #316 | Tragic 13.6% |
| Paiute | 0.0 /100 | #317 | Tragic 13.7% |
| Cree | 0.0 /100 | #318 | Tragic 13.7% |
| Americans | 0.0 /100 | #319 | Tragic 13.8% |
| Tlingit-Haida | 0.0 /100 | #320 | Tragic 13.8% |
| Shoshone | 0.0 /100 | #321 | Tragic 13.8% |
| Apache | 0.0 /100 | #322 | Tragic 14.0% |
| Osage | 0.0 /100 | #323 | Tragic 14.0% |
| Comanche | 0.0 /100 | #324 | Tragic 14.1% |
| Ottawa | 0.0 /100 | #325 | Tragic 14.1% |
| Natives/Alaskans | 0.0 /100 | #326 | Tragic 14.2% |
| Potawatomi | 0.0 /100 | #327 | Tragic 14.2% |
| Chippewa | 0.0 /100 | #328 | Tragic 14.3% |
| Cajuns | 0.0 /100 | #329 | Tragic 14.4% |
| Navajo | 0.0 /100 | #330 | Tragic 14.4% |