Latvian vs Cree Receiving Food Stamps
COMPARE
Latvian
Cree
Receiving Food Stamps
Receiving Food Stamps Comparison
Latvians
Cree
9.1%
RECEIVING FOOD STAMPS
99.8/ 100
METRIC RATING
20th/ 347
METRIC RANK
13.7%
RECEIVING FOOD STAMPS
0.8/ 100
METRIC RATING
246th/ 347
METRIC RANK
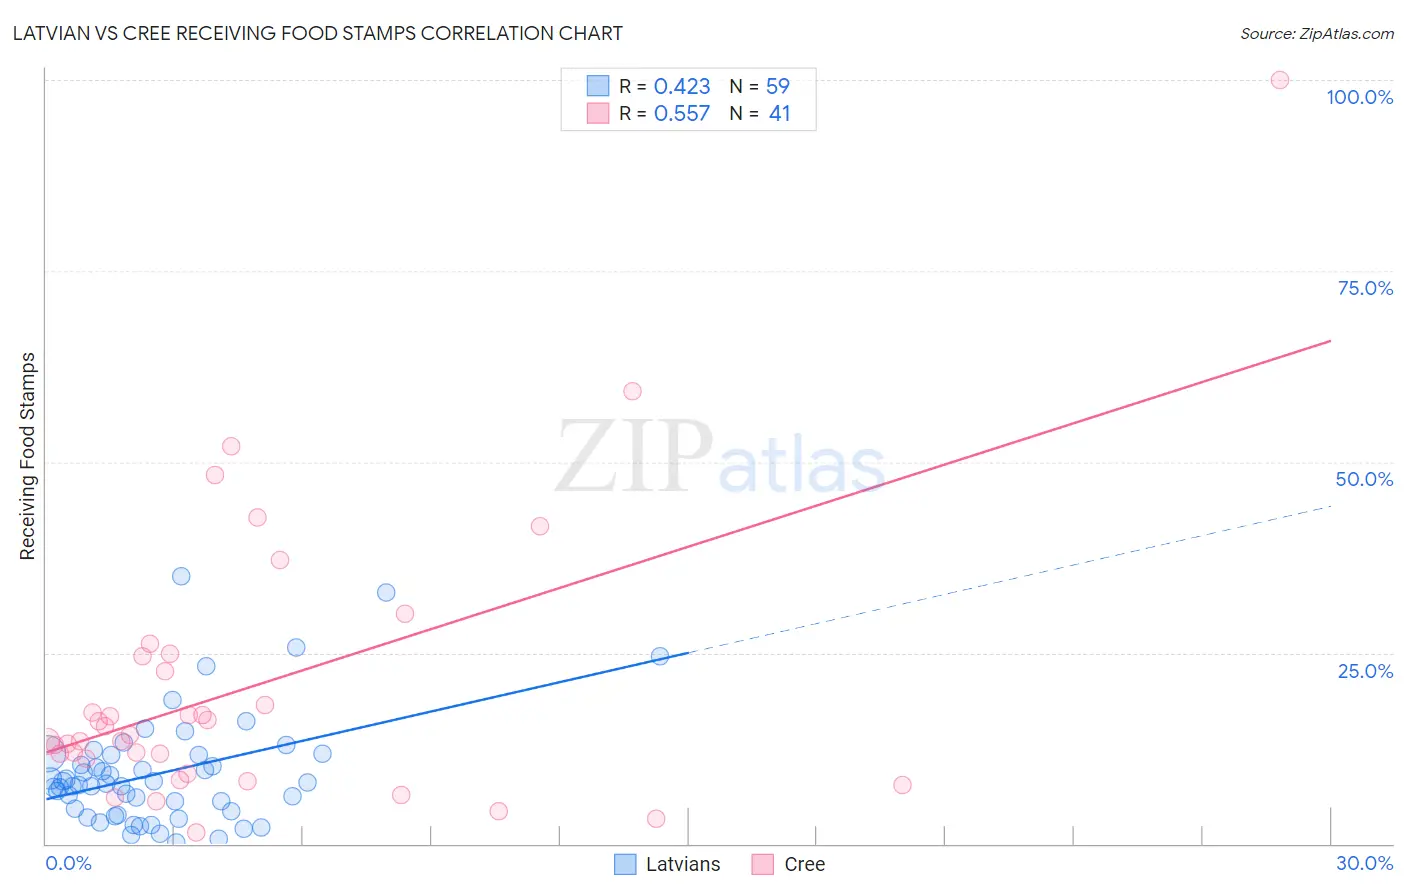
Latvian vs Cree Receiving Food Stamps Correlation Chart
The statistical analysis conducted on geographies consisting of 220,272,537 people shows a moderate positive correlation between the proportion of Latvians and percentage of population receiving government assistance and/or food stamps in the United States with a correlation coefficient (R) of 0.423 and weighted average of 9.1%. Similarly, the statistical analysis conducted on geographies consisting of 76,186,239 people shows a substantial positive correlation between the proportion of Cree and percentage of population receiving government assistance and/or food stamps in the United States with a correlation coefficient (R) of 0.557 and weighted average of 13.7%, a difference of 50.4%.
Receiving Food Stamps Correlation Summary
| Measurement | Latvian | Cree |
| Minimum | 0.20% | 1.5% |
| Maximum | 35.1% | 100.0% |
| Range | 34.9% | 98.5% |
| Mean | 9.3% | 20.6% |
| Median | 7.9% | 14.2% |
| Interquartile 25% (IQ1) | 4.2% | 10.1% |
| Interquartile 75% (IQ3) | 11.7% | 24.7% |
| Interquartile Range (IQR) | 7.5% | 14.6% |
| Standard Deviation (Sample) | 7.2% | 18.6% |
| Standard Deviation (Population) | 7.2% | 18.4% |
Similar Demographics by Receiving Food Stamps
Demographics Similar to Latvians by Receiving Food Stamps
In terms of receiving food stamps, the demographic groups most similar to Latvians are Luxembourger (9.1%, a difference of 0.15%), Immigrants from Hong Kong (9.1%, a difference of 0.33%), Immigrants from Australia (9.2%, a difference of 0.40%), Eastern European (9.2%, a difference of 0.51%), and Immigrants from Northern Europe (9.2%, a difference of 0.54%).
| Demographics | Rating | Rank | Receiving Food Stamps |
| Bulgarians | 99.9 /100 | #13 | Exceptional 8.9% |
| Maltese | 99.9 /100 | #14 | Exceptional 8.9% |
| Norwegians | 99.9 /100 | #15 | Exceptional 9.0% |
| Immigrants | Japan | 99.9 /100 | #16 | Exceptional 9.0% |
| Immigrants | Scotland | 99.9 /100 | #17 | Exceptional 9.0% |
| Danes | 99.9 /100 | #18 | Exceptional 9.0% |
| Immigrants | Hong Kong | 99.8 /100 | #19 | Exceptional 9.1% |
| Latvians | 99.8 /100 | #20 | Exceptional 9.1% |
| Luxembourgers | 99.8 /100 | #21 | Exceptional 9.1% |
| Immigrants | Australia | 99.8 /100 | #22 | Exceptional 9.2% |
| Eastern Europeans | 99.8 /100 | #23 | Exceptional 9.2% |
| Immigrants | Northern Europe | 99.8 /100 | #24 | Exceptional 9.2% |
| Immigrants | Ireland | 99.8 /100 | #25 | Exceptional 9.2% |
| Swedes | 99.8 /100 | #26 | Exceptional 9.2% |
| Bhutanese | 99.8 /100 | #27 | Exceptional 9.2% |
Demographics Similar to Cree by Receiving Food Stamps
In terms of receiving food stamps, the demographic groups most similar to Cree are Immigrants from Somalia (13.7%, a difference of 0.24%), Mexican American Indian (13.8%, a difference of 0.27%), Cajun (13.7%, a difference of 0.28%), Immigrants from Laos (13.8%, a difference of 0.36%), and Somali (13.7%, a difference of 0.44%).
| Demographics | Rating | Rank | Receiving Food Stamps |
| Immigrants | Micronesia | 1.3 /100 | #239 | Tragic 13.5% |
| Iroquois | 1.2 /100 | #240 | Tragic 13.5% |
| Choctaw | 1.0 /100 | #241 | Tragic 13.6% |
| Immigrants | Panama | 1.0 /100 | #242 | Tragic 13.6% |
| Somalis | 0.9 /100 | #243 | Tragic 13.7% |
| Cajuns | 0.9 /100 | #244 | Tragic 13.7% |
| Immigrants | Somalia | 0.9 /100 | #245 | Tragic 13.7% |
| Cree | 0.8 /100 | #246 | Tragic 13.7% |
| Mexican American Indians | 0.7 /100 | #247 | Tragic 13.8% |
| Immigrants | Laos | 0.7 /100 | #248 | Tragic 13.8% |
| Indonesians | 0.6 /100 | #249 | Tragic 13.9% |
| Immigrants | Cambodia | 0.5 /100 | #250 | Tragic 13.9% |
| Yaqui | 0.5 /100 | #251 | Tragic 13.9% |
| Ghanaians | 0.5 /100 | #252 | Tragic 14.0% |
| Spanish Americans | 0.4 /100 | #253 | Tragic 14.0% |