Alsatian vs Immigrants from Lithuania Median Female Earnings
COMPARE
Alsatian
Immigrants from Lithuania
Median Female Earnings
Median Female Earnings Comparison
Alsatians
Immigrants from Lithuania
$40,060
MEDIAN FEMALE EARNINGS
68.0/ 100
METRIC RATING
161st/ 347
METRIC RANK
$43,317
MEDIAN FEMALE EARNINGS
99.9/ 100
METRIC RATING
52nd/ 347
METRIC RANK
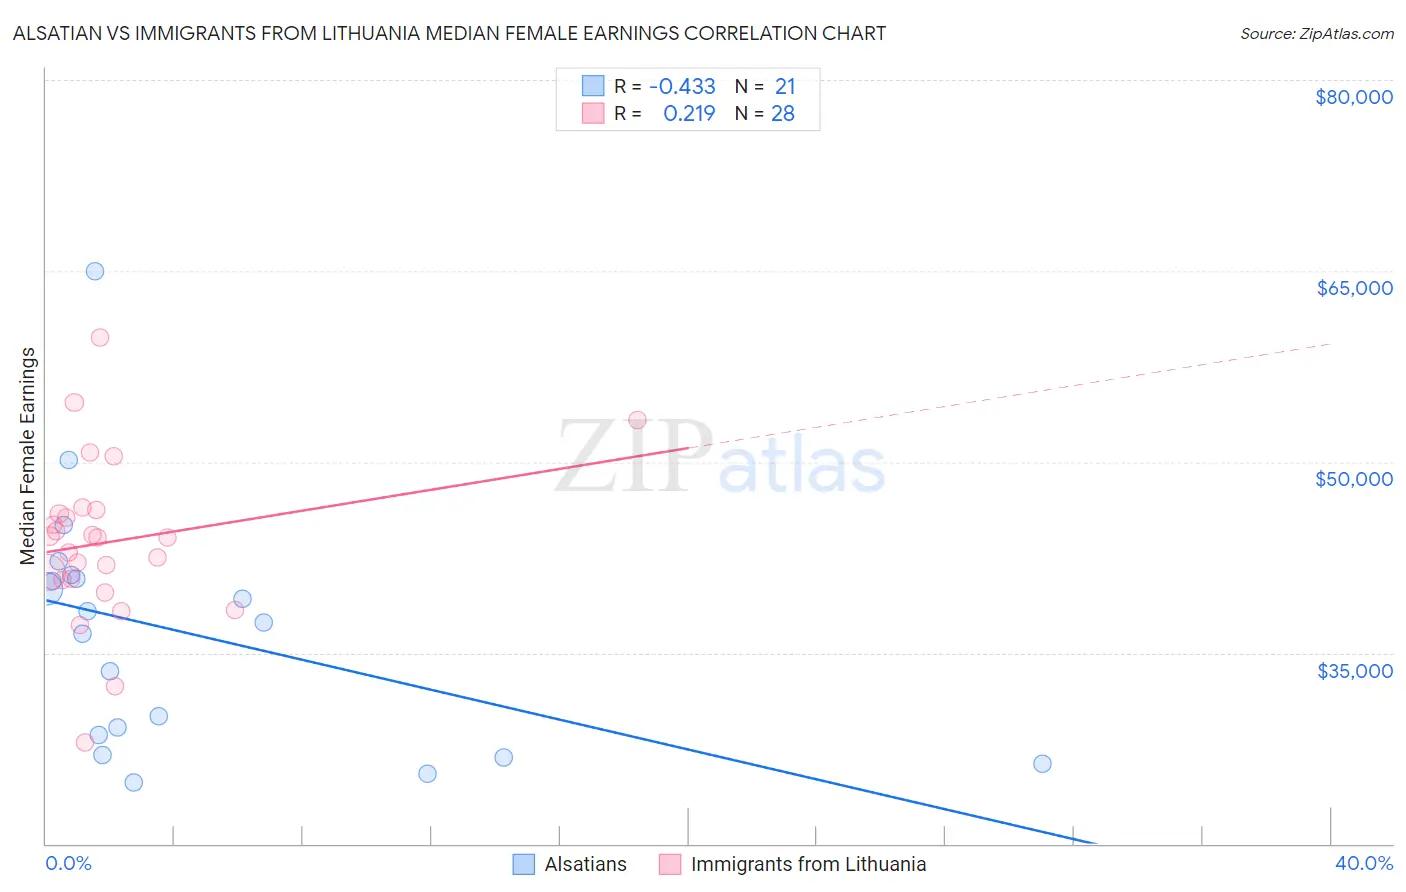
Alsatian vs Immigrants from Lithuania Median Female Earnings Correlation Chart
The statistical analysis conducted on geographies consisting of 82,671,266 people shows a moderate negative correlation between the proportion of Alsatians and median female earnings in the United States with a correlation coefficient (R) of -0.433 and weighted average of $40,060. Similarly, the statistical analysis conducted on geographies consisting of 117,702,564 people shows a weak positive correlation between the proportion of Immigrants from Lithuania and median female earnings in the United States with a correlation coefficient (R) of 0.219 and weighted average of $43,317, a difference of 8.1%.
Median Female Earnings Correlation Summary
| Measurement | Alsatian | Immigrants from Lithuania |
| Minimum | $24,833 | $27,947 |
| Maximum | $65,000 | $59,782 |
| Range | $40,167 | $31,835 |
| Mean | $36,577 | $43,754 |
| Median | $37,425 | $44,042 |
| Interquartile 25% (IQ1) | $27,720 | $40,753 |
| Interquartile 75% (IQ3) | $40,989 | $46,071 |
| Interquartile Range (IQR) | $13,268 | $5,319 |
| Standard Deviation (Sample) | $9,753 | $6,428 |
| Standard Deviation (Population) | $9,518 | $6,312 |
Similar Demographics by Median Female Earnings
Demographics Similar to Alsatians by Median Female Earnings
In terms of median female earnings, the demographic groups most similar to Alsatians are Inupiat ($40,080, a difference of 0.050%), South American Indian ($40,019, a difference of 0.10%), Lebanese ($40,006, a difference of 0.14%), Immigrants from Vietnam ($40,153, a difference of 0.23%), and Immigrants from Senegal ($40,157, a difference of 0.24%).
| Demographics | Rating | Rank | Median Female Earnings |
| Immigrants | Oceania | 77.6 /100 | #154 | Good $40,297 |
| Immigrants | Africa | 76.2 /100 | #155 | Good $40,257 |
| Peruvians | 75.3 /100 | #156 | Good $40,234 |
| Portuguese | 73.0 /100 | #157 | Good $40,177 |
| Immigrants | Senegal | 72.2 /100 | #158 | Good $40,157 |
| Immigrants | Vietnam | 72.0 /100 | #159 | Good $40,153 |
| Inupiat | 68.9 /100 | #160 | Good $40,080 |
| Alsatians | 68.0 /100 | #161 | Good $40,060 |
| South American Indians | 66.1 /100 | #162 | Good $40,019 |
| Lebanese | 65.5 /100 | #163 | Good $40,006 |
| Immigrants | Saudi Arabia | 62.9 /100 | #164 | Good $39,952 |
| Immigrants | Bangladesh | 60.8 /100 | #165 | Good $39,910 |
| Immigrants | Ghana | 60.0 /100 | #166 | Good $39,894 |
| Luxembourgers | 59.9 /100 | #167 | Average $39,891 |
| Immigrants | Peru | 58.9 /100 | #168 | Average $39,871 |
Demographics Similar to Immigrants from Lithuania by Median Female Earnings
In terms of median female earnings, the demographic groups most similar to Immigrants from Lithuania are Immigrants from Eastern Europe ($43,309, a difference of 0.020%), Australian ($43,308, a difference of 0.020%), Egyptian ($43,305, a difference of 0.030%), Maltese ($43,357, a difference of 0.090%), and Immigrants from Uzbekistan ($43,363, a difference of 0.11%).
| Demographics | Rating | Rank | Median Female Earnings |
| Immigrants | Europe | 100.0 /100 | #45 | Exceptional $43,523 |
| Immigrants | Bolivia | 100.0 /100 | #46 | Exceptional $43,467 |
| Bolivians | 100.0 /100 | #47 | Exceptional $43,445 |
| Immigrants | Indonesia | 100.0 /100 | #48 | Exceptional $43,412 |
| Immigrants | Serbia | 100.0 /100 | #49 | Exceptional $43,385 |
| Immigrants | Uzbekistan | 100.0 /100 | #50 | Exceptional $43,363 |
| Maltese | 100.0 /100 | #51 | Exceptional $43,357 |
| Immigrants | Lithuania | 99.9 /100 | #52 | Exceptional $43,317 |
| Immigrants | Eastern Europe | 99.9 /100 | #53 | Exceptional $43,309 |
| Australians | 99.9 /100 | #54 | Exceptional $43,308 |
| Egyptians | 99.9 /100 | #55 | Exceptional $43,305 |
| Immigrants | Croatia | 99.9 /100 | #56 | Exceptional $43,258 |
| Ethiopians | 99.9 /100 | #57 | Exceptional $43,243 |
| Paraguayans | 99.9 /100 | #58 | Exceptional $43,173 |
| Estonians | 99.9 /100 | #59 | Exceptional $43,106 |